Comparative Study
. 2004 Aug;114(3):389-98.
doi: 10.1172/JCI20855.

Expanded B cell population blocks regulatory T cells and exacerbates ileitis in a murine model of Crohn disease

Affiliations
Comparative Study

Expanded B cell population blocks regulatory T cells and exacerbates ileitis in a murine model of Crohn disease

Timothy S Olson et al. J Clin Invest. 2004 Aug.

Abstract

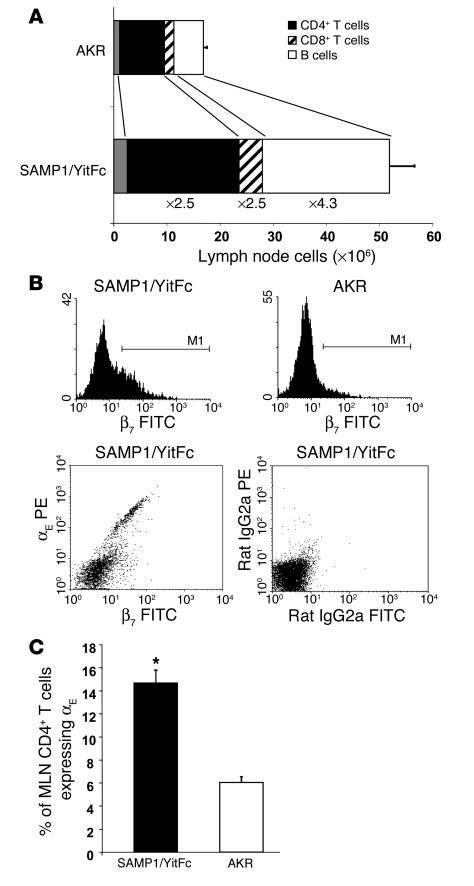
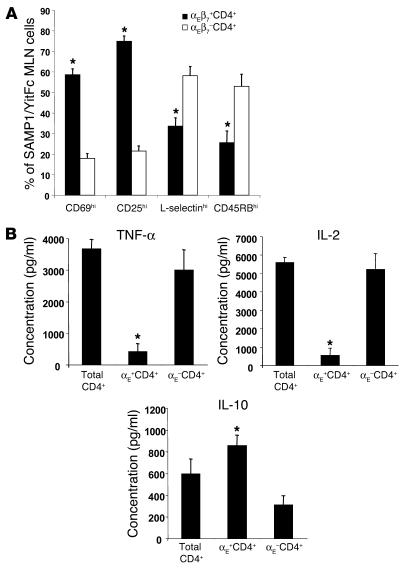
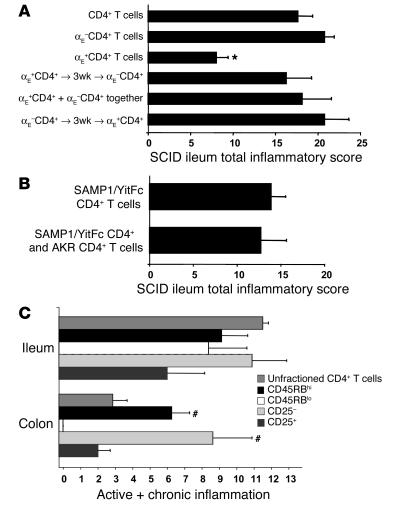
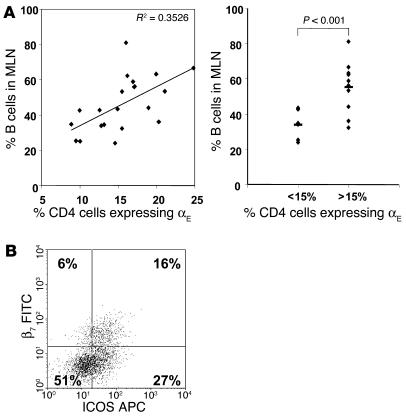
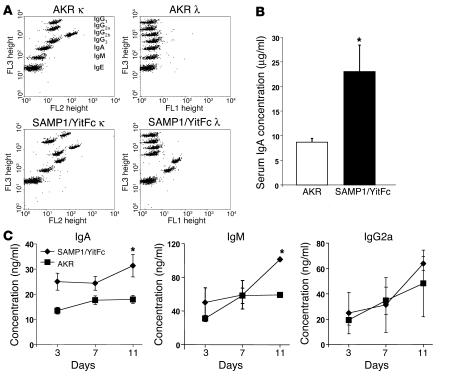
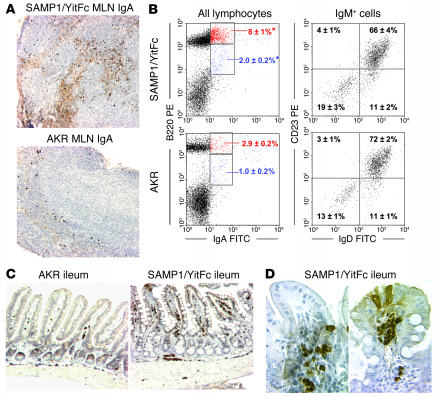
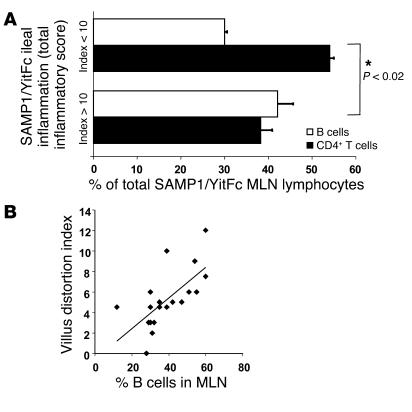
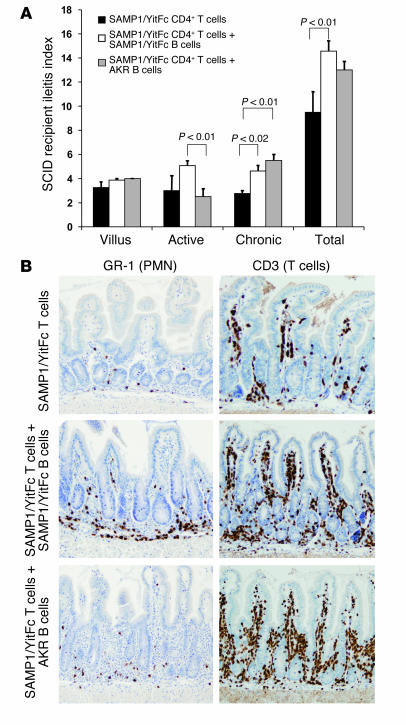
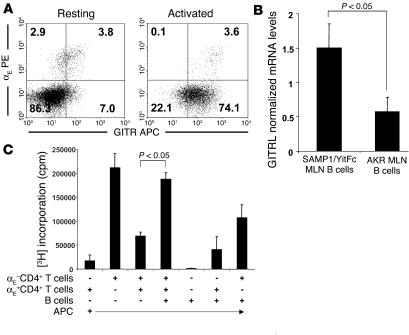
SAMP1/YitFc mice develop discontinuous, transmural inflammatory lesions in the terminal ileum, similar to what is found in human Crohn disease. Compared with the mesenteric lymph nodes (MLNs) of AKR control mice, SAMP1/YitFc MLNs contain a 4.3-fold expansion in total B cell number and a 2.5-fold increased percentage of CD4(+) T cells expressing the alpha(E)beta(7) integrin. Although alpha(E)beta(7)(+)CD4(+) T cells possess a regulatory phenotype (CD25(+), L-selectin(lo), and CD45RB(lo)), express IL-10, and suppress effector T cell proliferation in vitro, they cannot prevent ileitis development in SCID mice adoptively transferred with effector CD4(+) T cells, although the CD4(+)CD25(+) subset, which overlaps with the alpha(E)beta(7)(+)CD4(+) subset, prevents colitis. The alpha(E)beta(7)(+)CD4(+) T cells express high levels of ICOS, a costimulatory molecule that augments B cell function, suggesting their involvement in the increase in B cells, IgA(+) cells, and soluble IgA found within the MLNs and ileum of SAMP1/YitFc mice. MLN B cell numbers correlate with ileitis severity in SAMP1/YitFc mice, and cotransfer of SAMP1/YitFc MLN B cells along with CD4(+) T cells increases ileitis severity in SCID mice compared with transfer of CD4(+) T cells alone. SAMP1/YitFc B cells prevent alpha(E)beta(7)(+)CD4(+) T cells from suppressing effector T cell proliferation. We conclude that SAMP1/YitFc MLN B cells contribute to the development of SAMP1/YitFc ileitis.


Figures

Figure 1
Figure 1
Expanded B cell and αEβ7+CD4+ T cell populations in SAMP1/YitFc versus AKR MLN. (A) Total lymphocyte numbers (mean ± SEM) presented as the percentage of total cells in AKR and SAMP1/YitFc MLNs — as determined by lymphocyte-gated flow cytometry — that are CD4+ T cells (n = 16 and 32, respectively), CD8+ T cells (n = 10 and 19, respectively), and B cells (n = 13 and 24, respectively). Fold increases in the overall size of each of these populations in SAMP1/YitFc versus AKR are indicated. (B) Top, CD4+ T cell–gated histograms of β7 integrin chain expression on MLN cells from SAMP1/YitFc and AKR mice, showing that SAMP1/YitFc mice have an increased percentage of CD4+ T cells expressing high levels of β7. Bottom, the β7hi cells express β7 as a dimer with the αE integrin chain, as αE+ cells display a 1:1 correlation of αE to β7 expression in β7 versus αE dot plots that is not seen in isotype controls. (C) Comparison of the percentage (mean ± SEM) of MLN CD4+ T cells that are αE+ in SAMP1/YitFc mice (n = 31) versus AKR mice (n = 21). *Significantly greater (P < 0.05) than AKR cell percentage.
Figure 2
Figure 2
SAMP1/YitFc MLN αEβ7+CD4+ T cells possess a regulatory phenotype. (A) Comparison of the percentage of MLN cells, determined by flow cytometry, that express high levels of CD69 (n = 9 mice), CD25 (n = 9), L-selectin (n = 14), and CD45RB (n = 8) within the αEβ7+CD4+ and αEβ7CD4+ T cell subsets. (B) Levels of secreted TNF-α, IL-2, and IL-10, measured by cytometric bead array in triplicate, from 48-hour cultures of SAMP1/YitFc MLN unfractionated CD4+ T cells (Total CD4+), αE+CD4+ T cells, or αECD4+ T cells (105 cells/well), stimulated with immobilized anti-CD3 and soluble anti-CD28. Values represent the averages of three independent experiments for each group. *Significantly different (P < 0.05) compared to αEβ7CD4+ T cell population.
Figure 3
Figure 3
SAMP1/YitFc Treg populations block colitis, but not ileitis, in the CD4+ T cell adoptive transfer model. (A) Comparison of adoptively transferred ileitis severity (6 weeks after transfer, mean ± SEM) in SCID recipients (n = 4 in each group) induced by 5 × 10⁵ SAMP1/YitFc total MLN CD4+ T cells, αECD4+ T cells, αE+CD4+ T cells, or combination treatment using αE+CD4+ T cells injected 3 weeks (3wk) before, at the same time as, or 3 weeks after αECD4+ T cells. (B) In a separate cohort of SCID mice, severity of ileitis induced by 5 × 10⁵ SAMP1/YitFc CD4+ T cells (n = 4) was not decreased by coinjection of 5 × 10⁵ AKR MLN CD4+ T cells (n = 5). Total inflammatory scores represent the sum of three individual histological indices, including active inflammation, chronic inflammation, and villus architectural distortion. (C) In a third cohort, adoptively transferred ileitis and colitis severities were compared among SCID mice 6 weeks after mice received 5 × 10⁵ SAMP1/YitFc MLN unfractionated CD4+, CD45RBhiCD4+, CD45RBloCD4+, CD25CD4+, or CD25+CD4+ T cells. Because villus distortion is not measured in colitis, the sum of active and chronic inflammatory scores was used for this comparison. Data are expressed as mean ± SEM. *Significantly decreased (P < 0.05) compared with ileitis severity in mice receiving αEβ7CD4+ cells. #Significantly increased compared with colitis severity in mice receiving unfractionated CD4+ T cells.
Figure 4
Figure 4
Correlation between B cell expansion and αEβ7+CD4+ T cells. (A) Left, correlation (r = 0.6) between B cell number as a percentage of all MLN cells and the percentage of MLN CD4+ cells expressing αE in individual SAMP1/YitFc mice (n = 21). Right, comparison of the percentage of B cells in MLNs of mice with αE+CD4+ cells comprising greater than versus less than 15% of the MLN CD4+ population (line represents mean). (B) Representative CD4+-gated dot plot and average quadrant percentages (n = 10) showing expression of β7 integrin versus ICOS on SAMP1/YitFc MLN CD4+ T cells.
Figure 5
Figure 5
Soluble IgA production increased in SAMP1/YitFc versus AKR mice. (A) Representative dot plots of κ (1:100 dilution, FL2) and λ (1:1, FL1) light chain antibody isotype levels within MLN supernatants from AKR mice (n = 2) and SAMP1/YitFc mice (n = 2), measured with a cytometric bead array containing isotype-specific beads with preset FL3 intensities. MLNs were crushed, resuspended in 5 ml, and centrifuged to remove the cell pellet from the tested supernatants. An increase of at least twofold in IgG1 κ, IgA κ, IgM κ, IgA λ, and IgM λ was seen in SAMP1/YitFc versus AKR MLNs, as measured by mean fluorescence intensity of the isotype-specific beads. (B) ELISA detecting IgA antibody concentrations (mean ± SEM) in serum samples collected via cardiac puncture from SAMP1/YitFc mice (n = 12) and wild-type AKR mice (n = 13). (C) Concentrations of IgA (n = 4), IgM (n = 2), and IgG2a (n = 2), measured in triplicate by ELISA, from 3-, 7-, and 11-day anti-CD3–stimulated cocultures of SAMP1/YitFc CD4+ T cells and B cells versus AKR CD4+ T cells and B cells (105 T cells/well and 105 B cells/well). *Significantly greater than AKR concentrations (P < 0.05).
Figure 6
Figure 6
SAMP1/YitFc MLN and ileum contain large populations of IgA+ cells. (A) SAMP1/YitFc MLN (top) contain considerably more IgA-secreting cells (dark brown spots) and soluble IgA (diffuse light brown) than do AKR MLN (bottom), as shown by immunostaining of paraffin-embedded MLN sections. (B) Left, representative dot plots of B220 versus IgA expression, with quadrant percentages (mean ± SEM), demonstrating an increase in mature B cells (B220hi) and plasmablasts (B220int) expressing IgA in SAMP1/YitFc MLNs (n = 13) versus AKR MLNs (n = 6). *Significantly greater (P < 0.05) than AKR cell percentage. Right, IgM+-gated dot plots, with quadrant percentages (mean ± SEM), showing that less than 20% of SAMP1/YitFc (n = 13) or AKR (n = 6) MLN B cells have a CD23IgD B1 cell phenotype. (C) Low-power view (magnification, ×10) of paraffin-embedded ileal sections immunostained for IgA, showing increased concentrations of IgA-secreting cells (dark brown spots) throughout and increased soluble IgA within the villi (diffuse light brown) in SAMP1/YitFc versus AKR ilea. (D) High-power views (magnification, ×40) show IgA-secreting cells and soluble IgA focally concentrated in the base (left) and the tip (right) of two villi within SAMP1/YitFc ilea.
Figure 7
Figure 7
B cell population expansion correlates with disease severity in SAMP1/YitFc mice. (A) Percentages of CD4+ T cells (black) and CD19+ B cells (white) within MLNs (mean ± SEM) of individual SAMP1/YitFc mice (n = 20) in which the total inflammatory score of the distal ileum was greater than 10 (mean ± SEM = 15 ± 1; n = 14) or less than 10 (mean ± SEM = 5 ± 1; n = 6). *CD4+ T cell and B cell percentages are significantly different (P < 0.02) between the two groups. (B) The percentage of B cells in MLNs of mice (n = 20) correlates (r = 0.7) with the villus distortion component of the histopathological scoring index.
Figure 8
Figure 8
Cotransfer of MLN B cells increases ileitis severity in the CD4+ T cell adoptive transfer model. (A and B) A total of 5 × 10⁵ CD4+ T cells from pooled SAMP1/YitFc MLNs (n = 6) were injected intraperitoneally into SCID mice either alone (n = 4) or in combination with 2 × 10⁶ SAMP1/YitFc (n = 8) or AKR (n = 4) MLN B cells intravenously. (A) After 6 weeks, SCID mice receiving both SAMP1/YitFc T cells and SAMP1/YitFc B cells had higher chronic and total inflammatory scores than those of mice receiving T cells alone, while mice receiving AKR B cells and SAMP1/YitFc T cells had an intermediate phenotype. (B) Immunostaining of paraffin-embedded ileal sections, revealing an increase in T cell (CD3+ cells) infiltrates in SCID mice receiving cotransfer of B cells from either strain compared with that of mice receiving T cells alone, and an increased neutrophil (GR-1+ cells) infiltrate in mice receiving specifically SAMP1/YitFc B cells. PMN, polymorphonuclear granulocytes.
Figure 9
Figure 9
SAMP1/YitFc MLN B cells block Treg function in vitro. (A) Increased expression of GITR on freshly isolated or 24 hour–activated (anti-CD3) αE+CD4+ versus αECD4+ T cells. (B) Increased mRNA expression of GITRL, measured by real-time RT-PCR and normalized to total 18S rRNA, on isolated MLN B cells from SAMP1/YitFc mice (n = 8) versus AKR mice (n = 6). (C) B cells expressing GITRL block αE+ Treg cell function. SAMP1/YitFc irradiated splenic APCs (1 × 10⁵ cells/well) were cultured with combinations of MLN αE+CD4+ T cells, αECD4+ T cells, and B cells (5 × 10⁴ each) stimulated for 3 days with immobilized anti-CD3. [3H]thymidine was added to the cultures 24 hours before analysis. The αE+ Treg cells blocked the proliferation of effector T cells, while the addition of B cells to the coculture blocked the Treg cell–mediated inhibition. Data reflect mean ± SEM of two independent experiments.

Similar articles

Cited by

References

    1. Elson CO. Genes, microbes, and T cells--new therapeutic targets in Crohn’s disease. N. Engl. J. Med. 2002;346:614–616. - PubMed
    1. Bouma G, Strober W. The immunological and genetic basis of inflammatory bowel disease. Nat. Rev. Immunol. 2003;3:521–533. - PubMed
    1. Dieckgraefe BK, Korzenik JR. Treatment of active Crohn’s disease with recombinant human granulocyte-macrophage colony-stimulating factor. Lancet. 2002;360:1478–1480. - PubMed
    1. Boone DL, Ma A. Connecting the dots from Toll-like receptors to innate immune cells and inflammatory bowel disease. J. Clin. Invest. 2003;111:1284–1286. doi:10.1172/JCI200318545. - PMC - PubMed
    1. Dalwadi H, et al. B cell developmental requirement for the G alpha i2 gene. J. Immunol. 2003;170:1707–1715. - PubMed

Publication types