Comparative Study
. 2004 Aug 2:4:24.
doi: 10.1186/1471-2148-4-24.

Function and evolution of the serotonin-synthetic bas-1 gene and other aromatic amino acid decarboxylase genes in Caenorhabditis

Affiliations
Comparative Study

Function and evolution of the serotonin-synthetic bas-1 gene and other aromatic amino acid decarboxylase genes in Caenorhabditis

Emily E Hare et al. BMC Evol Biol. .

Abstract

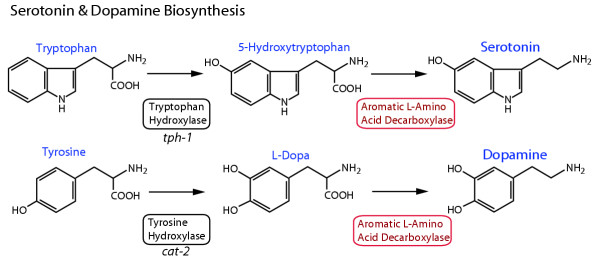
Background: Aromatic L-amino acid decarboxylase (AADC) enzymes catalyze the synthesis of biogenic amines, including the neurotransmitters serotonin and dopamine, throughout the animal kingdom. These neurotransmitters typically perform important functions in both the nervous system and other tissues, as illustrated by the debilitating conditions that arise from their deficiency. Studying the regulation and evolution of AADC genes is therefore desirable to further our understanding of how nervous systems function and evolve.

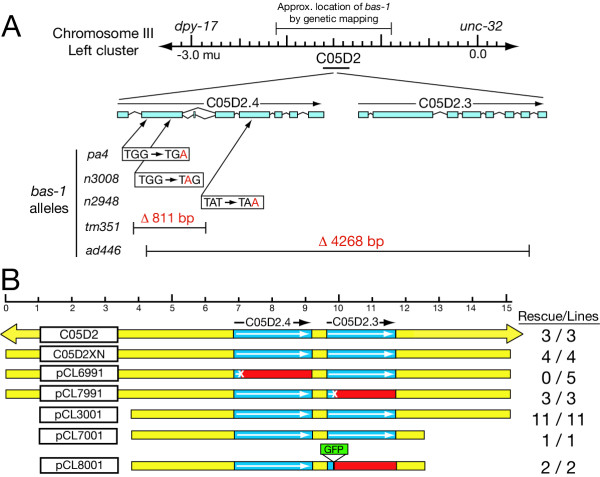
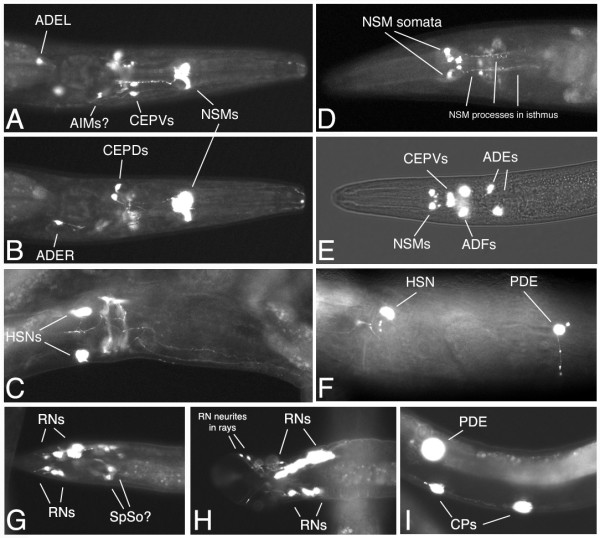
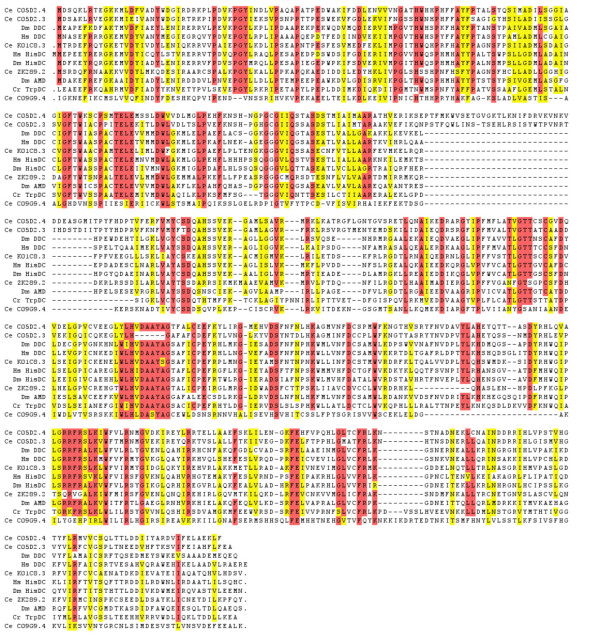
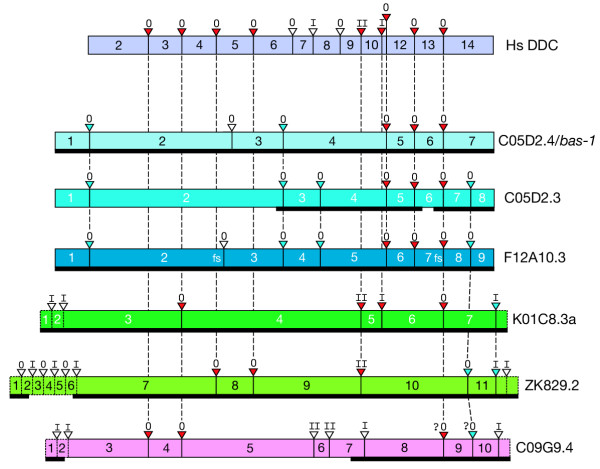
Results: In the nematode C. elegans, the bas-1 gene is required for both serotonin and dopamine synthesis, and maps genetically near two AADC-homologous sequences. We show by transformation rescue and sequencing of mutant alleles that bas-1 encodes an AADC enzyme. Expression of a reporter construct in transgenics suggests that the bas-1 gene is expressed, as expected, in identified serotonergic and dopaminergic neurons. The bas-1 gene is one of six AADC-like sequences in the C. elegans genome, including a duplicate that is immediately downstream of the bas-1 gene. Some of the six AADC genes are quite similar to known serotonin- and dopamine-synthetic AADC's from other organisms whereas others are divergent, suggesting previously unidentified functions. In comparing the AADC genes of C. elegans with those of the congeneric C. briggsae, we find only four orthologous AADC genes in C. briggsae. Two C. elegans AADC genes - those most similar to bas-1 - are missing from C. briggsae. Phylogenetic analysis indicates that one or both of these bas-1-like genes were present in the common ancestor of C. elegans and C. briggsae, and were retained in the C. elegans line, but lost in the C. briggsae line. Further analysis of the two bas-1-like genes in C. elegans suggests that they are unlikely to encode functional enzymes, and may be expressed pseudogenes.

Conclusions: The bas-1 gene of C. elegans encodes a serotonin- and dopamine-synthetic AADC enzyme. Two C. elegans AADC-homologous genes that are closely related to bas-1 are missing from the congeneric C. briggsae; one or more these genes was present in the common ancestor of C. elegans and C. briggsae. Despite their persistence in C. elegans, evidence suggests the bas-1-like genes do not encode functional AADC proteins. The presence of the genes in C. elegans raises questions about how many 'predicted genes' in sequenced genomes are functional, and how duplicate genes are retained or lost during evolution. This is another example of unexpected retention of duplicate genes in eukaryotic genomes.


Figures

Figure 1
Figure 1
Serotonin and dopamine biosynthetic pathways. Serotonin and dopamine are synthesized from the aromatic amino acids tryptophan and tyrosine, respectively. The first and rate-limiting step in synthesis is carried out by a neurotransmitter-specific aromatic amino acid hydroxylase enzyme, either tryptophan or tyrosine hydroxylase. In C. elegans, these genes are encoded by the tph-1 and cat-2 genes, respectively [19, 25]. The second synthetic step for both neurotransmitters shares the aromatic L-amino acid decarboxylase (AADC) enzyme, which has a relatively broad substrate specificity, and is also known as 5-hydroxytryptophan decarboxylase or dopa decarboxylase.
Figure 2
Figure 2
Molecular genetics and transformation rescue of bas-1. (A) Genetic and physical map of bas-1 region and bas-1 mutant alleles. Locations and extent of mutations for each bas-1 allele are shown to scale with respect to C05D2.4 and C05D2.3 coding sequences, based on known splicing patterns or Genefinder predictions. Exons are indicated by rectangular bars; an alternatively spliced 27 bp exon is also indicated after exon 2 in C05D2.4. Four of five bas-1 mutants affect only C05D2.4; ad446 is a larger deletion removing most coding sequence of both C05D2.4 and C05D2.3. (B) Genomic DNA constructs that rescue or fail to rescue bas-1 mutants. Constructs are shown to scale (top), based on the 15.1 kbp insert of the plasmid clone C05D2XN; construct names are indicated in the box on the left. The cosmid C05D2 is larger, as indicated by the arrows. Clones below are subclones or modifications of C05D2XN. Coding regions for the two predicted AADC genes C05D2.4 and C05D2.3 are indicated by the blue boxes; intergenic regions are shown in yellow. C05D2XN upstream of C05D2.4 contains two other predicted genes, one complete (C05D2.8) and one partial (C05D2.5). There are no predicted genes in the 3 kb downstream of C05D2.3. In the constructs with the least upstream sequence, only a portion of C05D2.8 remains. Constructs mutated to introduce premature stop codons are indicated with a X in the coding sequence, and red downstream of the introduced stop codon. The construct pCL8001 has a GFP gene inserted in a manner that would inactivate the C05D2.3 gene, so is comparable to the pCL7991 construct. [No GFP expression was seen in the C05D2.3::GFP reporter construct lines.]
Figure 3
Figure 3
C. elegans bas-1 cDNA sequences. (A) Consensus cDNA sequence and translation for C05D2.4/bas-1, based on the most common splice form. Nucleotide numbering is shown on the left side and amino acid numbering on the right side of the sequence. SL1 spliced leader sequence is overlined in blue in the top line. Intron locations are indicated with blue arrowheads; the phase at all intron locations is 0 (between codons; see also Fig 6). The conserved lysine (K) pyridoxal 5-phosphate binding site at amino acid 343 is boxed in black. Red amino acids in the predicted Bas-1 protein (T286, D292, H309, D311, S336, K343, K357, V378, R393, and W401) are identical to those shown to be essential for rat AADC function [5, 41, 42]. Possible phosphorylation sites that are absolutely conserved in known DDC and HisDC proteins are boxed in green (Y37, S149, S229, S230). The polyadenylation signal in the final line is underlined. Mutations found in bas-1 alleles are indicated with the allele designation and the changed base over the wildtype sequence. The allele tm351 deletion, which removes the entire second exon, is indicated by a red line over the missing sequence. The wildtype cDNA sequence shown is consistent with our RT-PCR clones (primers SL1B, C05D2-B), those we sequenced from the ORFeome project (from predicted translation start to stop), and C. elegans EST project 'YK clones' ends (used to determine the 3' end, including the site of polyadenylation). (B) Alternatively spliced 27 bp exon and surrounding genomic sequence in C. elegans and C. briggsae. The additional exon is found in a fraction of C. elegans bas-1 transcripts, and the sequence is conserved in genomic sequence from C. briggsae as shown. [We did not isolate a cDNA containing this exon among our C. briggsae bas-1 cDNAs, S. DePaul & C. Loer, unpublished results.] Predicted translation of the exon is shown above or below the nucleotide sequence. Consensus splice signals are overlined in blue, and identical nucleotides are indicated by vertical lines between the two nucleotide sequences.
Figure 4
Figure 4
Expression pattern of a bas-1::GFP reporter fusion in transgenic Roller worms. (Panels A-C are from the same adult hermaphrodite. Ventral is down and anterior to the right.) A. Ventral, slightly oblique view of the head, showing NSMs, CEPDs, ADEL and likely AIMs. B. Same head, higher (more dorsal) focal plane, showing CEPDs and ADER. C. Photomontage showing ventral oblique view of HSNs and their processes in the ventral nerve cord; note also apparent labeling of muscles associated with the vulva. A second worm is immediately adjacent above, obscuring the edge of the worm shown. (Panels D-F: Anterior is to the left.) D. Adult hermaphrodite head, ventral view, chosen to show the characteristic highly varicose processes of the NSM cells within the isthmus of the pharynx. E. Larval head, ventral view with fluorescence and brightfield. This clearly shows the location of the NSM somata in the ventral pharynx, anterior bulb; it also shows the serotonergic ADF neurons not seen in A, B. CEPDs would be seen in a dorsal focal plane in this worm. F. Adult hermaphrodite lateral view of body wall. Ventral is down. Shows HSN and PDE; note PDE process extending ventrally toward the ventral nerve cord and dendrite extending dorsally into postdeirid sensillum. Twisting of the body axis associated with Roller phenotype makes HSN and PDE somata appear at the same lateral level when HSN is actually located sublateral and PDE subdorsal; twisting also takes ventral nerve cord out of plane of focus in the right of the panel. (Panels G – I are from males; anterior is to the right.) G. Late L4 male tail showing ray neurons (RNs) with processes extending into the rays. In some males we saw spicule cell staining likely belonging to spicule socket cells (SpSo). Ventral, slightly oblique view. H. Adult male tail showing RNs and their neurites in rays 7 and 9 on the right side, view ventral, slightly oblique. I. Male-specific ventral nerve cord motoneurons CP5 and CP6, the CP neurons most commonly expressing the transgene. The PDE soma in the lateral body wall is out of the plane of focus.
Figure 5
Figure 5
Alignments of AADC protein sequences with C. elegans BAS-1 predicted protein. Gaps are indicated with a dash (-); at the beginning or end of a sequence, periods indicate additional sequence upstream or downstream that is not shown. Alignments were performed with CLUSTALW. Abbreviations for species and gene names are the same as listed in the legend for Table 1. For genes with multiple splice forms, the most readily aligned sequence was chosen. Red shading indicates amino acids are identical in ≥ 90% of the aligned sequences. Yellow shading indicates similar amino acids found in that position in ≥ 90% of the aligned sequences.
Figure 6
Figure 6
Phylogenetic trees of AADC protein and nucleotide sequences. Trees were made from sequences aligned with CLUSTALW. Species and gene names are abbreviated as listed in the legend for Table 1. (A) The single minimum-length tree resulting from a heuristic search using parsimony from alignments of core protein sequences (531 characters) of selected C. elegans, C. briggsae, Human and Drosophila AADCs. C. roseus (periwinkle plant) TrpDC was used as an outgroup. Branch lengths are indicated, with bootstrap values using the same search conditions (1000 replicates) in parentheses. The search used the tree-bisection-reconnection (TBR) branch-swapping algorithm; characters were equally weighted. An identical tree topologically was obtained by a branch-and-bound search. C. elegans F12A10.3 was excluded from this analysis since it lacks a functional protein sequence (see Fig. 7 and text). Trees determined by distance methods were similar, but rearranged some of branches with low bootstrap values in the tree shown. (B) The single minimum-length tree resulting from a heuristic search using parsimony (same settings as above) of nucleotide sequence alignments (1608 characters) from a subset of AADCs above, with the addition of C. elegans F12A10.3. Dm DDC was used as an outgroup. Branch lengths and bootstrap values using the same search conditions (1000 replicates) are shown as in A. An identical tree topologically was obtained by a branch-and-bound search.
Figure 7
Figure 7
Genomic structure of C. elegans AADC genes compared with Human DDC. Rectangular blocks represent coding exons of the genes indicated (relative size of exons is approximate). Red triangles indicate ancient conserved introns found in both Human DDC and at least one of the C. elegans AADC genes; blue triangles indicate introns conserved among C. elegans AADC genes; and open triangles indicate non-conserved splice sites (comparing only among the genes shown). Roman numerals above triangles indicate the phase of the intron. Vertical dashed lines between solid triangles indicate splice sites conserved between at least two genes. Diagonal dashed lines indicate probable conserved sites that are shifted by 2–3 amino acids relative to the other splice site. Alignments of homologous splice sites are based on amino acid multiple alignments of the predicted proteins; insertions and deletions are ignored in the drawing. No alternative splicing is indicated; the most readily "alignable" version of each gene was used in cases with multiple splice variants. Dashed boxes at the ends of genes indicate non-AADC homologous extensions unique to the given gene. The most divergent AADC, C09G9.4, is more difficult to align; assignments of splice sites on either side of exon 9 as conserved are more tentative (indicated by question marks). In a few cases where gaps occur in the protein sequence alignments at intron-exon boundaries, introns marked as homologous only begin or end at an homologous location. The splicing pattern shown is fully supported by cDNA sequences for C05D2.4/bas-1, F12A10.3, K01C8.3, ZK829.2 ; the pattern is supported by partial cDNA sequences for C05D2.3 and C09G9.4. The extent of supporting cDNA sequence is shown by the heavy black line beneath the colored blocks. F12A10.3 is a special case in that frameshifts (indicated by 'fs') occur in the cDNA relative to the AADC homologous sequence. The first frameshift occurs at a site where many AADCs are spliced (and where a splice is incorrectly predicted by gene prediction programs), and the second at a splice junction.

Similar articles

Cited by

References

    1. Dawson TM, Dawson VL. Molecular pathways of neurodegeneration in Parkinson's disease. Science. 2003;302:819–822. doi: 10.1126/science.1087753. - DOI - PubMed
    1. Deakin JF. Depression and antisocial personality disorder: two contrasting disorders of 5HT function. J Neural Transm Suppl. 2003;64:79–93. - PubMed
    1. Zhu MY, Juorio AV. Aromatic L-amino acid decarboxylase: biological characterization and functional role. Gen Pharmac. 1995;26:681–696. doi: 10.1016/0306-3623(94)00223-A. - DOI - PubMed
    1. Wright TRF. The genetics of biogenic amine metabolism, sclerotization, and melanizaton in Drosophila melaogaster. Adv Genet. 1987;24:127–222. - PubMed
    1. Poupon A, Jebai F, labesse G, Gros F, Thibault J, Mornon J, Krieger M. Structure modelling and site-directed mutagenesis of the rat aromatic L-amino acid pyridoxal 5'-phosphate-dependent decarboxylase: a functional study. Proteins. 1999;37:191–203. doi: 10.1002/(SICI)1097-0134(19991101)37:2<191::AID-PROT5>3.0.CO;2-4. - DOI - PubMed

Publication types

MeSH terms

Substances

LinkOut - more resources