Comparative Study
. 2004;5(8):R55.
doi: 10.1186/gb-2004-5-8-r55. Epub 2004 Jul 14.

Origins of chromosomal rearrangement hotspots in the human genome: evidence from the AZFa deletion hotspots

Affiliations
Comparative Study

Origins of chromosomal rearrangement hotspots in the human genome: evidence from the AZFa deletion hotspots

Matthew E Hurles et al. Genome Biol. 2004.

Abstract

Background: The origins of the recombination hotspots that are a common feature of both allelic and non-allelic homologous recombination in the human genome are poorly understood. We have investigated, by comparative sequencing, the evolution of two hotspots of non-allelic homologous recombination on the Y chromosome that lie within paralogous sequences known to sponsor deletions resulting in male infertility.

Results: These recombination hotspots are characterized by signatures of concerted evolution, which indicate that gene conversion between paralogs has been predominant in shaping their recent evolution. By contrast, the paralogous sequences that surround the hotspots exhibit little evidence of gene conversion. A second feature of these rearrangement hotspots is the extreme interspecific sequence divergence (around 2.5%) that places them among the most divergent orthologous sequences between humans and chimpanzees.

Conclusions: Several hominid-specific gene conversion events have rendered these hotspots better substrates for chromosomal rearrangements in humans than in chimpanzees or gorillas. Monte Carlo simulations of sequence evolution suggest that extreme sequence divergence is a direct consequence of gene conversion between paralogs. We propose that the coincidence of signatures of concerted evolution and recurrent breakpoints of chromosomal rearrangement (mapped at the sequence level) may enable the identification of putative rearrangement hotspots from analysis of comparative sequences from great apes.


Figures
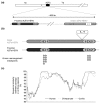
Figure 1
Figure 1
The AZFa locus and flanking AZFa-HERV proviral sequences. (a) The AZFa locus on Yq is flanked by two HERV15 proviral sequences in direct orientation. (b) The proximal and distal AZFa-HERVs are aligned with one another, with the inserted L1 material excised. The 15 known rearrangement breakpoints are shown by stars and fall in the ID1 and ID2 hotspot intervals within the AZFa-HERVs. (c) The plot of similarity between AZFa-HERV sequences in each of the three species shows that these hotspots are coincident, with greatest sequence similarity in humans, but that the sequence similarity in chimpanzees and gorillas is lower at these hotspots than in human.
Figure 2
Figure 2
Evidence of concerted evolution at ID1 and ID2. (a) Neighbor-joining trees of comparative sequences over three intervals within the AZFa-HERVs (Pt, Pan troglodytes; Hs, Homo sapiens; Gg, Gorilla gorilla). (b) Phylogenetic networks of the same three intervals. (c) Two segments of an ID2 alignment demonstrating alternative directions of gene conversion events. Variant positions within the alignment relative to the human sequences are highlighted in black. In the first panel of the ID2 alignment, multiple variants specific to the proximal paralog in both chimpanzee and gorilla sequences are missing from humans, suggesting gene conversion on the hominid lineage using the distal paralog as a donor. By contrast, the second panel of the same alignment indicates gene conversion of the opposite directionality.
Figure 3
Figure 3
Sequence divergence between orthologous sequences within AZFa-HERVs. (a) Comparison of sequence divergence at three different sequence classes: two at AZFa-HERV (non-hotspot (non-ID) and hotspot (ID1+ID2)) and one from elsewhere on the Y chromosome (SMCY). Pairwise comparisons of three hominoid species (Pt, Pan troglodytes; Hs, Homo sapiens; Gg, Gorilla gorilla) were made. AZFa-HERV sequence divergences represent averages over both proximal and distal copies. The ID1 and ID2 sequence divergences are averaged to give ID1+ID2, rather than the sequence concatenated. (b) Sequence divergences between individual pairs of orthologous sequences at ID1 and ID2.
Figure 4
Figure 4
Sliding-window analyses across the AZFa-HERV alignment. Beneath the schematic alignment of the proximal and distal AZFa-HERVs (with the inserted L1 material excised) are sliding-window analyses showing how various sequence measures vary across the alignment. These statistics represent the mean of these values across all three pairwise comparisons. The three measures applied are: the orthologous sequence divergence, the concerted index (CI) and the directionality index (DI), where the CI is greater than 0.5 (see text for details).
Figure 5
Figure 5
The model of sequence evolution incorporated into the simulations. See text for explanation. p1, proximal repeat in species 1; p2, proximal repeat in species 2; d1, distal repeat in species 1; d2, distal repeat in species 2.
Figure 6
Figure 6
The effect of varying gene conversion rate on paralog and ortholog sequence similarity. Sequence similarities represent averages over 1,000 simulations. The two paralog pairwise comparisons (p1 vs d1 and p2 vs d2) are averaged together, as are the two ortholog comparisons (p1 vs p2 and d1 vs d2). Length of simulation 8 × 10⁶ years; generation time 20 years; base substitution rate 4 × 10⁻⁸ per nucleotide per generation; gene conversion rate 0.1 (representing 4 × 10⁻⁵ per locus per generation - equivalent to 1.4 × 10⁻⁶ per site per generation); initial paralog sequence divergence 2%; gene conversion directionality 0.5 (that is, unbiased); mean gene conversion tract length 352 bp.
Figure 7
Figure 7
Paralog and ortholog sequence similarity under gene conversion, assuming different levels of sequence divergence between the paralogs before speciation. Sequence similarities represent averages over 1,000 simulations. The two pairwise paralog comparisons (p1 vs d1 and p2 vs d2) are averaged together, as are the two ortholog comparisons (p1 vs p2 and d1 vs d2). Length of simulation 8 × 10⁶ years; generation time 20 years; base substitution rate 4 × 10⁻⁸ per nucleotide per generation; gene conversion rate 4 × 10⁻⁵ per locus per generation (equivalent to 1.4 × 10⁻⁶ per site per generation); mean gene conversion tract length 352 bp; gene conversion directionality 0.5 (unbiased).
Figure 8
Figure 8
Sliding-window analyses across the alignment of human and chimpanzee AZFa-HERVs. Beneath the schematic alignment of the proximal and distal AZFa-HERVs (with the inserted L1 material excised) are sliding-window analyses showing how various sequence measures vary across the alignment. The measures applied are: the CI (see text) and the mean paralogous (averaged over both species) and orthologous (averaged over proximal and distal AZFa-HERVs) sequence divergences where the CI is greater than 0.5.
Figure 9
Figure 9
The effect of directionality of gene conversion on paralog and ortholog sequence similarity. Sequence similarities represent averages over 1,000 simulations. The effects of different ratios of gene conversion directionality are considered on the sequence similarity of paralogs p1 and d1, and p2 and d2, and of orthologs p1 and p2, and d1 and d2. (a) Conversion proximal to distal 50%, distal to proximal 50%; (b) proximal to distal 25%, distal to proximal 75%; (c) proximal to distal 10%, distal to proximal 90%. Length of simulation 8 × 10⁶ years; generation time 20 years; base substitution rate 4 × 10⁻⁸ per nucleotide per generation; gene conversion rate 4 × 10⁻⁵ per locus per generation (equivalent to 1.4 × 10⁻⁶ per site per generation); mean conversion tract length 352 bp; initial paralog sequence divergence 2%.
Figure 10
Figure 10
Structure and possible mechanism of formation of the homogenized AZFa-HERVs present in humans. (a) Comparison of the wild-type structure of AZFa-HERVs and the homogenized distal AZFa-HERV between ID1 and ID2 that has had 1.5 kb of L1 material removed and has been generated at least twice during recent human evolution [9]. (b) Possible two-step mechanism by which such a long portion of the distal AZFa-HERV could be homogenized via a duplicated intermediate. The constitutively haploid nature of the Y chromosome means that the substrates for the unequal crossing-over event that generates the duplicated intermediate must be sister chromatids. The unequal crossing-over event that results in deletion back to two copies might be either intra-chromosomal or between sister chromatids.

Similar articles

Cited by

References

    1. Jeffreys AJ, Kauppi L, Neumann R. Intensely punctate meiotic recombination in the class II region of the major histocompatibility complex. Nat Genet. 2001;29:217–222. doi: 10.1038/ng1001-217. - DOI - PubMed
    1. Reiter LT, Murakami T, Koeuth T, Pentao L, Muzny DM, Gibbs RA, Lupski JR. A recombination hotspot responsible for two inherited peripheral neuropathies is located near a mariner transposon-like element. Nat Genet. 1996;12:288–297. - PubMed
    1. Stankiewicz P, Lupski JR. Genome architecture, rearrangements and genomic disorders. Trends Genet. 2002;18:74–82. doi: 10.1016/S0168-9525(02)02592-1. - DOI - PubMed
    1. Jobling MA, Williams G, Schiebel K, Pandya A, McElreavey K, Salas L, Rappold GA, Affara NA, Tyler-Smith C. A selective difference between human Y-chromosomal DNA haplotypes. Curr Biol. 1998;8:1391–1394. - PubMed
    1. Kauppi L, Sajantila A, Jeffreys AJ. Recombination hotspots rather than population history dominate linkage disequilibrium in the MHC class II region. Hum Mol Genet. 2003;12:33–40. doi: 10.1093/hmg/ddg008. - DOI - PubMed

Publication types

Substances

LinkOut - more resources