. 2004 Aug 15;18(16):1981-96.
doi: 10.1101/gad.1220104. Epub 2004 Aug 2.

The X-ray structure of the papillomavirus helicase in complex with its molecular matchmaker E2

Affiliations

The X-ray structure of the papillomavirus helicase in complex with its molecular matchmaker E2

Eric A Abbate et al. Genes Dev. .

Abstract

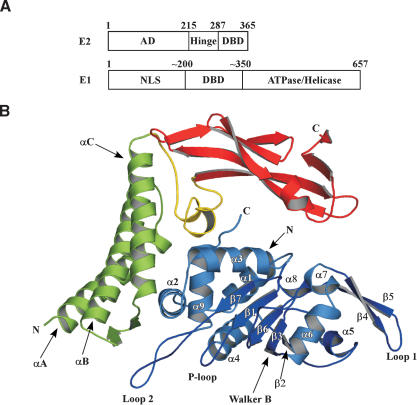
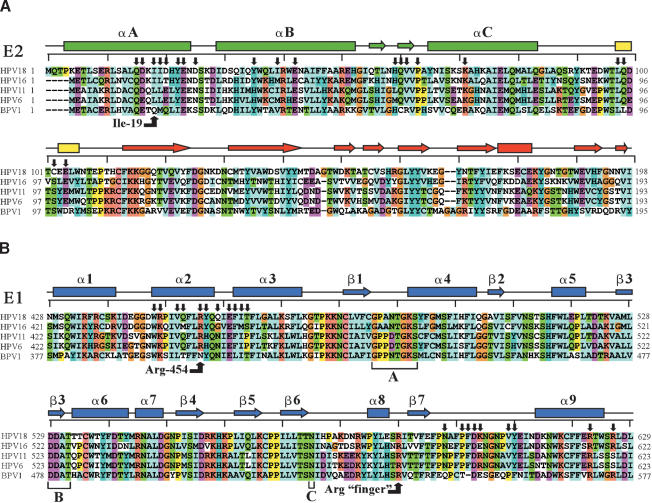
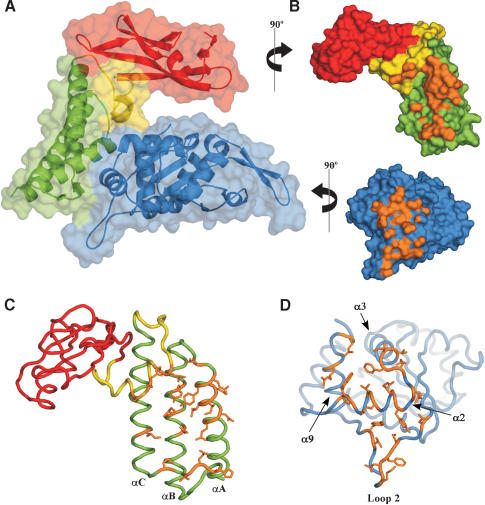
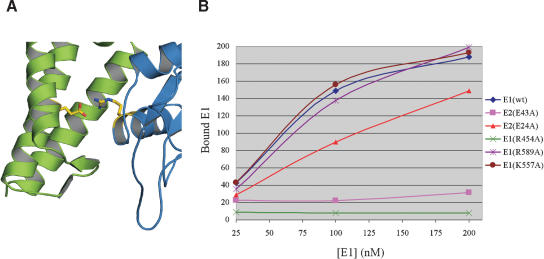
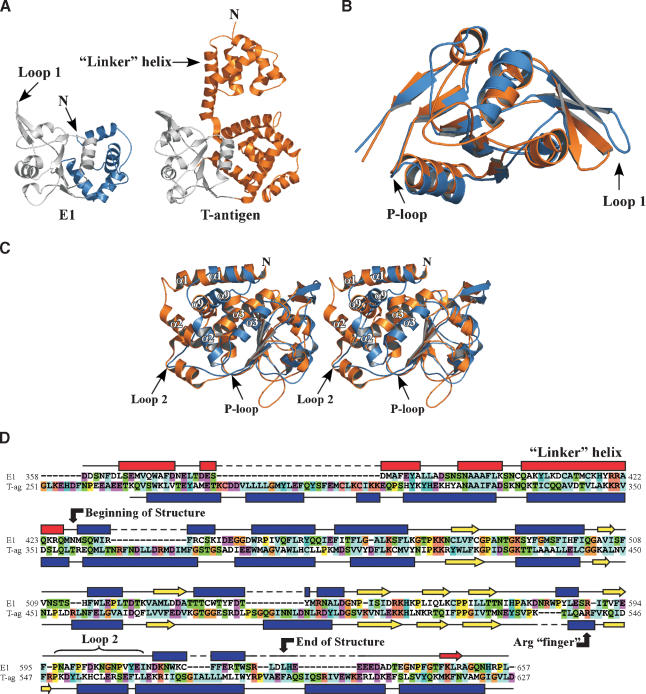
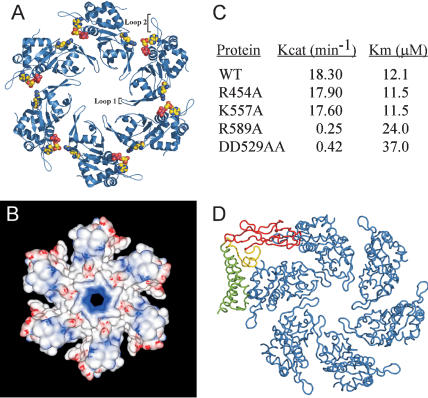
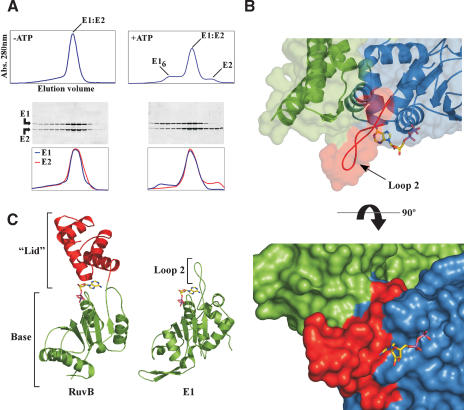
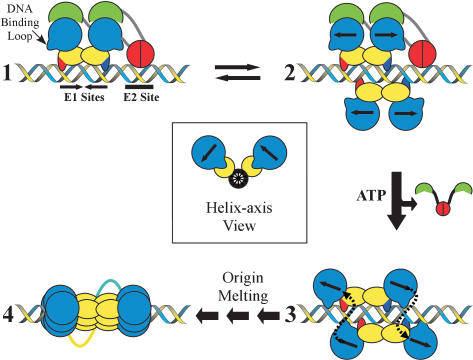
DNA replication of the papillomaviruses is specified by cooperative binding of two proteins to the ori site: the enhancer E2 and the viral initiator E1, a distant member of the AAA+ family of proteins. Formation of this prereplication complex is an essential step toward the construction of a functional, multimeric E1 helicase and DNA melting. To understand how E2 interacts with E1 to regulate this process, we have solved the X-ray structure of a complex containing the HPV18 E2 activation domain bound to the helicase domain of E1. Modeling the monomers of E1 to a hexameric helicase shows that E2 blocks hexamerization of E1 by shielding a region of the E1 oligomerization surface and stabilizing a conformation of E1 that is incompatible with ATP binding. Further biochemical experiments and structural analysis show that ATP is an allosteric effector of the dissociation of E2 from E1. Our data provide the first molecular insights into how a protein can regulate the assembly of an oligomeric AAA+ complex and explain at a structural level why E2, after playing a matchmaker role by guiding E1 to the DNA, must dissociate for subsequent steps of initiation to occur. Building on previously proposed ideas, we discuss how our data advance current models for the conversion of E1 in the prereplication complex to a hexameric helicase assembly.


Figures

Figure 1.
Figure 1.
Structure of the E1 · E2 complex. (A) The HPV18 E1 and E2 ORFs indicating the amino acid boundaries of key domains. (AD) Activation domain; (DBD) DNA-binding domain; (NLS) nuclear localization sequence. (B) Cartoon representation of the E1 · E2 structure. The N-terminal helical domain of E2 is colored green, the β-strand structural domain is colored red, and the linker segment between the two domains is yellow. E1 is depicted in blue. Secondary structural elements are labeled.
Figure 2.
Figure 2.
Sequence/structure alignment of papillomavirus E1 and E2 proteins. (A) Sequence alignment of the E2 activation domain from some important papillomaviral types. Amino acid boundaries for each variant are indicated and amino acids are colored according to their amino acid type. The secondary structure from the HPV18 E2 structure is depicted above the alignment. Helices are represented by rectangles, strands by arrows, and coil regions by black lines. Residues making contact between E1 and E2 are indicated by black arrows. The rulers above each alignment delineate 10-amino acid increments. (B) Sequence alignment of the homologous regions of various E1 proteins with the amino acids of HPV18 E1. Various elements are labeled as in A. Walker-A and Walker-B motifs and the SF3 superfamily C motif are indicated, as are two arginines critical for either the E1 · E2 interaction or ATPase activity of the E1 hexamer.
Figure 3.
Figure 3.
The E1 · E2 interaction surface. (A) Surface rendering of the E1 · E2 complex with underlying cartoon representation. The N-terminal helical domain of E2 is colored green, the C-terminal β-strand domain is in red, and the linker between the two is yellow. E1 is depicted in blue. (B) Exploded view of the E1 · E2 complex rotated to reveal the surface of interaction. The color scheme is as in A. The interaction surface between E1 and E2 (defined as atoms ≤4.5 Å apart) is depicted in orange. (C) Cα wire trace of E2 with residues involved in the E1 · E2 complex formation highlighted in orange. The color scheme is the same as in A. (D) Cα wire depiction of E1, with residues making contact between E1 and E2 depicted in orange.
Figure 4.
Figure 4.
Mutation of a conserved, buried ion pair at the E1 · E2 interface affects complex formation. (A) The three helices of the N-terminal domain of E2 are in green and E1 is colored blue. The side chains of the Glu 43:Arg 454 ion pair is highlighted yellow. (B) Graph of E1 · E2 pull-down data. The amount of E1 pulled-down by GST-E2 (100 nM) is plotted on the Y-axis in arbitrary units. The concentration of E1 used in each pull-down experiment is plotted on the X-axis.
Figure 5.
Figure 5.
Comparison of E1 and T antigen. (A) Side-by-side comparison of the SV40 T-antigen (PDB 1N25) and E1 helicase domain structures. The N-terminal domain in E1 that is critical for hexamerization was not contained in the fragment used for cocrystallization of the E1 · E2 complex. The N terminus of E1 is predicted to continue into a “linker helix” similar to that seen in T-antigen (see secondary structure alignments in D). The ATPase core for each protein is shown in gray. (B) Superposition of E1 and T-antigen ATPase core regions (colored gray in A), with E1 colored blue and T-antigen in orange. (C) Stereo view of the superposition of the entire E1 structure onto the analogous region of T-antigen. E1 is in blue and T-antigen in orange. The difference between E1 and T-antigen at the position of loop-2 in E1 is indicated. Analogous helices between E1 and T-antigen that form a knot-like structure are labeled. (D) Sequence and secondary structure alignments of E1 and T-antigen. The boundaries of the E1 structure are indicated. Helices and predicted helices are indicated by blue rectangles and red rectangles, respectively. Strands are represented by blue arrows and predicted strands are depicted as red arrows.
Figure 6.
Figure 6.
A predicted model for the helicase domain of the E1 hexamer. (A) Cartoon representation of the E1 hexamer resulting from superposition on SV40 T-antigen. Modeling of nucleotide bound to E1 is depicted (see Fig. 7), as is the arginine finger. (B) Electrostatic potential surface representation (GRASP; Nicholls et al. 1991) of the E1 hexamer. Areas of positive potential are blue and negative potential red. (C) Kinetic parameters for various E1 ATPase mutants. See Materials and Methods for a description of the assay. (D) Superposition of the E1 · E2 complex onto one subunit of the E1 hexamer. The E2 activation domain is depicted as in Figure 1B. The steric clash is diagrammed by the overlaps between the C-terminal β-strand domain of E2 (red) and a monomer of E1 (blue). Approximately 10% of the volume of E1 is invaded by the β-strand domain of E2.
Figure 7.
Figure 7.
Effect of ATP on the E1 · E2 complex. (A) Elution profile of the E1 · E2 complex from a gel filtration column in the presence and absence of ATP. These experiments were performed with the 358-631 construct of E1, which contains structural elements necessary for hexamerization (Fig. 5). An SDS-PAGE gel of fractions from the columns is shown below each chromatogram. A quantitative profile of the amount of E1 and E2 in each fraction (stained with SYPRO Orange and scanned with a Typhoon, Amersham) is given for each protein below the gels. (B) Superposition of RuvB (PDB 1IN4) bound to ADP onto E1 reveals the manner in which nucleotide would bind to E1. Overlay of the E1 · E2 surface shows the contacts between loop-2 of E1 and E2. E2 is colored green and E1 blue, with residues of loop-2 depicted in red. The view is the same as that of Figure 1B. The bottom panel depicts a surface representation of the E1 · E2 complex with modeled ADP showing the clash between the adenine ring and loop-2 of E1. (C) Structural comparison of E1 and the AAA+ protein RuvB. The ATPase modules are colored green. The C-terminal helical “lid” domain that clamps over the adenine of the bound nucleotide of RuvB is colored red.
Figure 8.
Figure 8.
Model for the assembly of E1 molecules at the viral origin. A dimer of E1 and a dimer of E2 bind to the viral origin (step 1). The E2 DNA-binding domains are depicted in red and the activation domains in green. The E1 DNA-binding domains are colored yellow and the helicase domains blue. The strands of DNA contacted by the E1 DNA-binding domains are shown by the red and blue extensions. In step 2, a second E1 dimer binds the PV origin. The inset (middle) view depicts how the second set of E1 molecules is predicted to bind to the DNA relative to the first (Enemark et al. 2002). Competition between the helicase domains of the second set of E1 molecules and the activation domain of E2, coupled with ATP binding, drives the conversion of intermediate 2 to 3. The helicase domains interact with partners across the helix, and the nonspecific DNA-binding loops of the E1 helicase domains are expected to engage DNA prior to or during oligomerization. Following this association, the recruitment of additional helicase domains leads to the assembly of the E1 double hexamer and may induce the melting of the viral origin (step 4).

References

    1. Alexandrov A.I., Botchan, M.R., and Cozzarelli, N.R. 2002. Characterization of simian virus 40 T-antigen double hexamers bound to a replication fork. The active form of the helicase. J. Biol. Chem. 277: 44886-44897. - PubMed
    1. Antson A.A., Burns, J.E., Moroz, O.V., Scott, D.J., Sanders, C.M., Bronstein, I.B., Dodson, G.G., Wilson, K.S., and Maitland, N.J. 2000. Structure of the intact transactivation domain of the human papillomavirus E2 protein. Nature 403: 805-809. - PubMed
    1. Bosch F.X., Manos, M.M., Munoz, N., Sherman, M., Jansen, A.M., Peto, J., Schiffman, M.H., Moreno, V., Kurman, R., and Shah, K.V. 1995. Prevalence of human papillomavirus in cervical cancer: A worldwide perspective. International biological study on cervical cancer (IBSCC) Study Group. J. Natl. Cancer Inst. 87: 796-802. - PubMed
    1. Bullock P.A. 1997. The initiation of simian virus 40 DNA replication in vitro. Crit. Rev. Biochem. Mol. Biol. 32: 503-568. - PubMed
    1. Chen G. and Stenlund, A. 1998. Characterization of the DNA-binding domain of the bovine papillomavirus replication initiator E1. J. Virol. 72: 2567-2576. - PMC - PubMed

Publication types

Associated data