Comparative Study
. 2004 Aug;14(8):1462-73.
doi: 10.1101/gr.2538704.

Regional patterns of gene expression in human and chimpanzee brains

Affiliations
Comparative Study

Regional patterns of gene expression in human and chimpanzee brains

Philipp Khaitovich et al. Genome Res. 2004 Aug.

Abstract

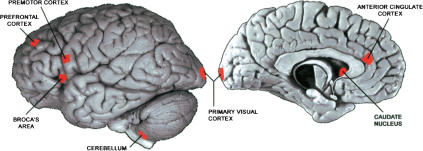
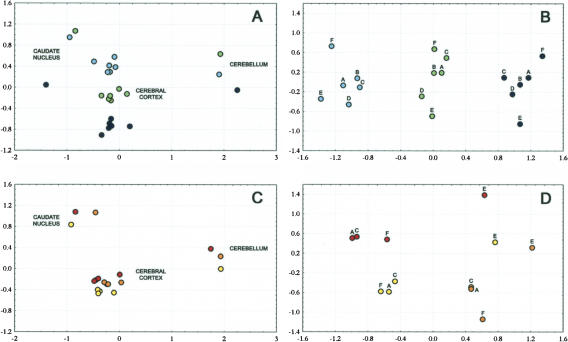
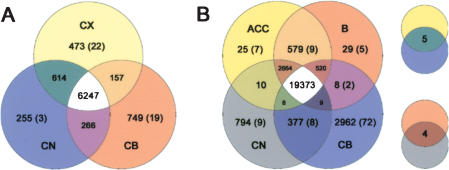
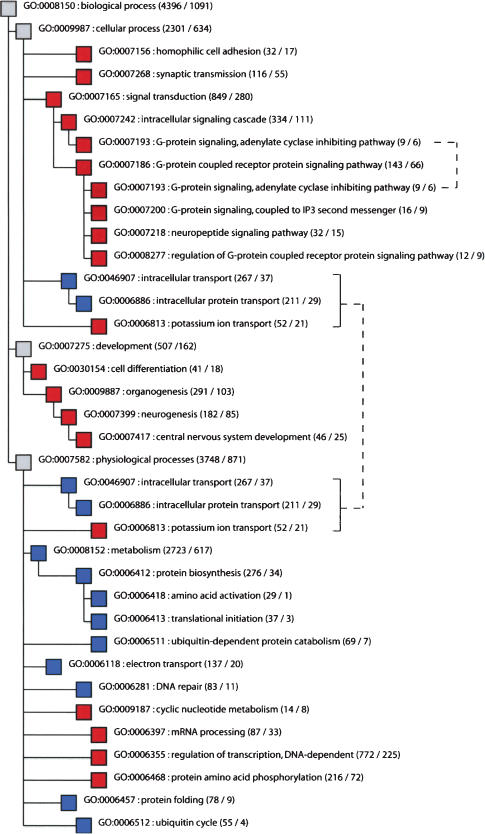
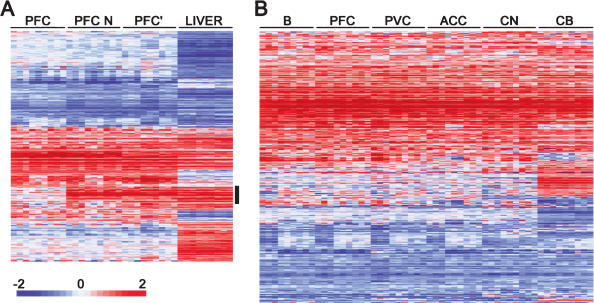
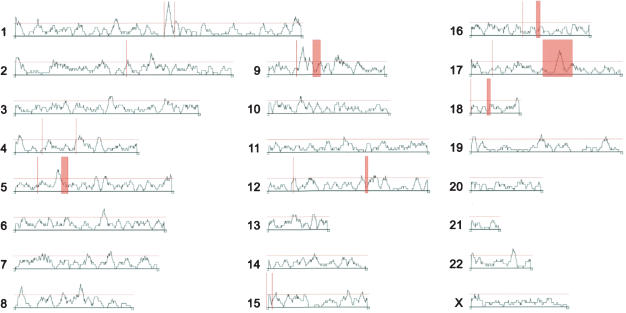
We have analyzed gene expression in various brain regions of humans and chimpanzees. Within both human and chimpanzee individuals, the transcriptomes of the cerebral cortex are very similar to each other and differ more between individuals than among regions within an individual. In contrast, the transcriptomes of the cerebral cortex, the caudate nucleus, and the cerebellum differ substantially from each other. Between humans and chimpanzees, 10% of genes differ in their expression in at least one region of the brain. The majority of these expression differences are shared among all brain regions. Whereas genes encoding proteins involved in signal transduction and cell differentiation differ significantly between brain regions within individuals, no such pattern is seen between the species. However, a subset of genes that show expression differences between humans and chimpanzees are distributed nonrandomly across the genome. Furthermore, genes that show an elevated expression level in humans are statistically significantly enriched in regions that are recently duplicated in humans.


Figures

Figure 1
Figure 1
Location of areas sampled from the human cerebral cortex. The size of the marked areas corresponds approximately to the size of the dissected tissue sample. The sample from the right hemisphere (not shown) was taken from the location that mirrors the location of Broca's area. The human brain pictures are reprinted with permission from the Digital Anatomist Project, Department of Biological Structure, University of Washington © 1998 (http://www9.biostr.washington.edu/da.html).
Figure 2
Figure 2
Multidimensional scaling plots of gene expression differences identified within species. The colors refer to individuals. (A) Expression differences in humans. (B) Expression differences within the human cerebral cortex. (A) Broca's area; (B) homolog of Broca's area in the right hemisphere; (C) prefrontal cortex; (D) premotor cortex; (E) primary visual cortex; (F) anterior cingulate cortex. (C) Expression differences in chimpanzees. (D) Expression differences within the chimpanzee cerebral cortex. Labels as in (B).
Figure 3
Figure 3
Number of genes exhibiting expression patterns specific to brain regions in humans and chimpanzees. (A) Genes with region-specific expression among the cerebral cortex (CX), the caudate nucleus (CN), and cerebellum (CB). Genes with expression specific for the cerebral cortex were defined as not showing any significant difference among the four cerebral cortex regions but significant differences to both the caudate nucleus and the cerebellum in at least one of these four regions. The numbers of genes with correlation coefficients <0.6 between human and chimpanzee brain expression profiles are shown in parentheses. (B) Genes with region-specific expression among four brain regions in a broader analysis of the transcriptome including the anterior cingulate cortex (ACC) and Broca's area (B).
Figure 4
Figure 4
Groups of genes that show significant excess or significant lack of gene expression differences among brain regions in the GO taxonomy “biological process.” Red indicates significant excess of differentially expressed genes, and blue indicates significant lack of expression differences. Numbers of detected and differentially expressed genes in a group are shown in parentheses. Brackets to the right indicate cases in which the same functional group occurs multiple times in the tree.
Figure 5
Figure 5
Gene expression differences between humans and chimpanzees. (A) Hierarchical clustering of expression differences between humans and chimpanzees in the prefrontal cortex in the current data set with (PFC) and without (PFC N) masking of the sequence differences between the species and previously published prefrontal cortex (PFC′) and liver data (Enard et al. 2002). All genes differentially expressed in at least one tissue and detected in the other one are shown. The vertical black bar indicates the cluster of expression differences that disappears after the masking procedure. (B) Hierarchical clustering of genes classified as differentially expressed between humans and chimpanzees in at least one out of six studied brain regions. Each row represents a gene and each column represents a pairwise comparison between one human and one chimpanzee in a given tissue. The magnitude of expression differences is shown as the base two logarithm of the ratio of the gene expression level in humans to the one in chimpanzees. Higher expression in humans is shown in red and higher expression in chimpanzees in blue, with color intensity being proportional to the magnitude of the expression difference as indicated by the color bar at the bottom of the figure. (B) Broca's area; (PFC) prefrontal cortex; (PVC) primary visual cortex; (ACC) anterior cingulate cortex; (CN) caudate nucleus; and (CB) cerebellum.
Figure 6
Figure 6
Distribution of gene expression differences between human and chimpanzee brains across the human genome. The profile over each chromosome shows the proportion of the differentially expressed genes in sliding windows containing 21 detected genes. Red horizontal lines indicate 5% significance cutoff. Red vertical bars indicate cytological bands to which the breakpoints of chromosomal rearrangements between humans and chimpanzees have been mapped (Yunis and Prakash 1982).

References

    1. Ashburner, M., Ball, C.A., Blake, J.A., Botstein, D., Butler, H., Cherry, J.M., Davis, A.P., Dolinski, K., Dwight, S.S., Eppig, J.T., et al. 2000. Gene ontology: Tool for the unification of biology. The Gene Ontology Consortium. Nat. Genet. 25: 25–29. - PMC - PubMed
    1. Bailey, J.A., Yavor, A.M., Massa, H.F., Trask, B.J., and Eichler, E.E. 2001. Segmental duplications: Organization and impact within the current human genome project assembly. Genome Res. 11: 1005–1017. - PMC - PubMed
    1. Bailey, J.A., Gu, Z., Clark, R.A., Reinert, K., Samonte, R.V., Schwartz, S., Adams, M.D., Myers, E.W., Li, P.W., and Eichler, E.E. 2002. Recent segmental duplications in the human genome. Science 297: 1003–1007. - PubMed
    1. Caceres, M., Lachuer, J., Zapala, M.A., Redmond, J.C., Kudo, L., Geschwind, D.H., Lockhart, D.J., Preuss, T.M., and Barlow, C. 2003. Elevated gene expression levels distinguish human from non-human primate brains. Proc. Natl. Acad. Sci. 100: 13030–13035. - PMC - PubMed
    1. Enard, W., Khaitovich, P., Klose, J., Zollner, S., Heissig, F., Giavalisco, P., Nieselt-Struwe, K., Muchmore, E., Varki, A., Ravid, R., et al. 2002. Intra- and interspecific variation in primate gene expression patterns. Science 296: 340–343. - PubMed

Publication types