. 2004 Aug 2;200(3):353-65.
doi: 10.1084/jem.20040213.

Intracellular triggering of Fas aggregation and recruitment of apoptotic molecules into Fas-enriched rafts in selective tumor cell apoptosis

Affiliations

Intracellular triggering of Fas aggregation and recruitment of apoptotic molecules into Fas-enriched rafts in selective tumor cell apoptosis

Consuelo Gajate et al. J Exp Med. .

Abstract

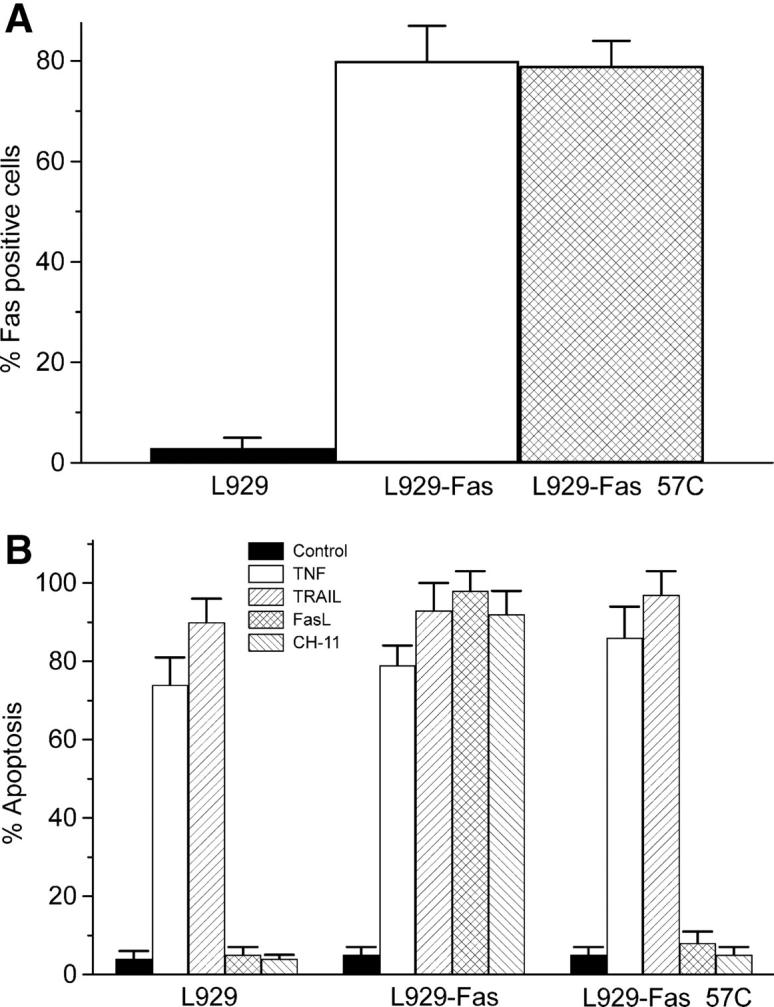
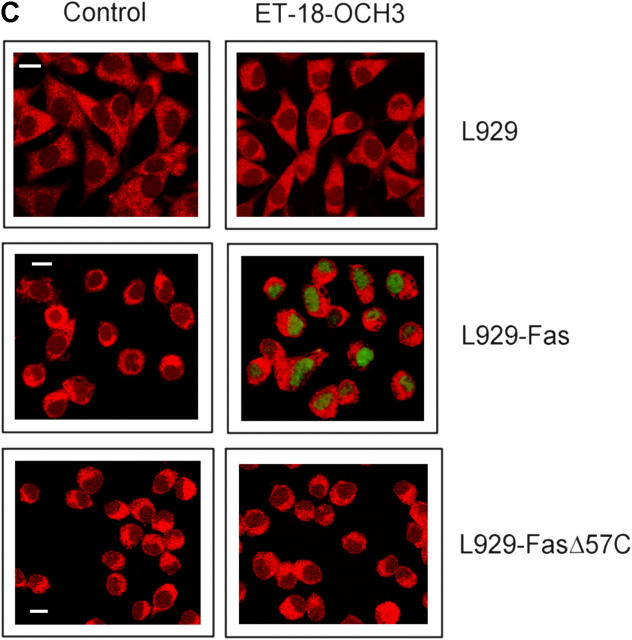
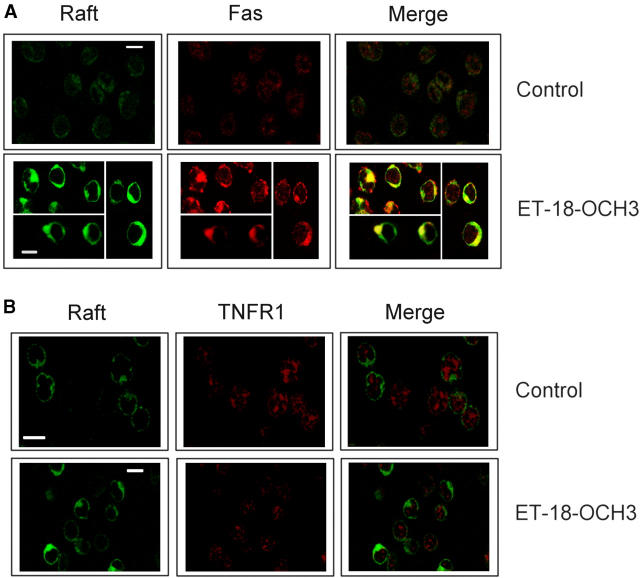
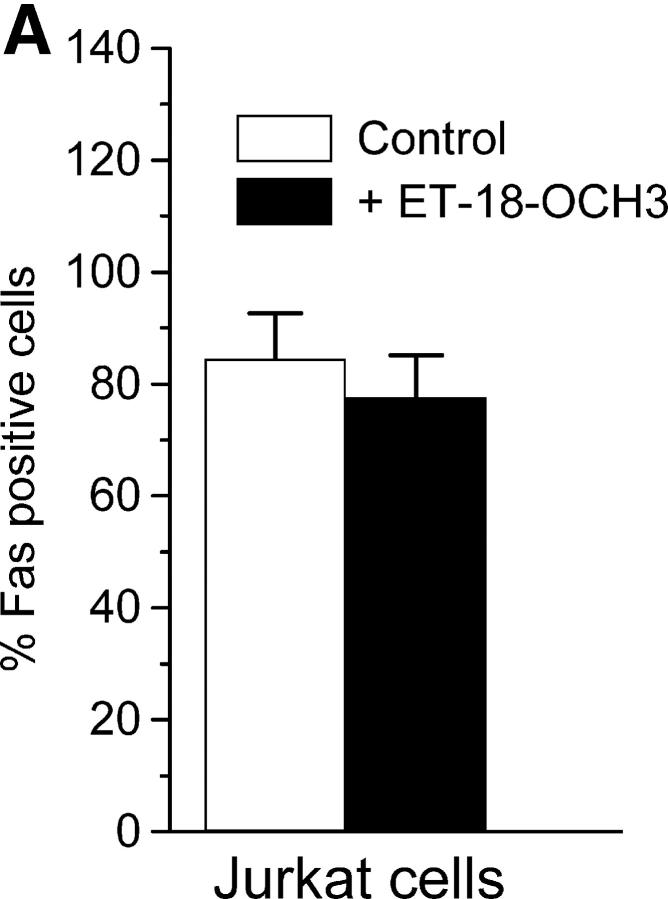
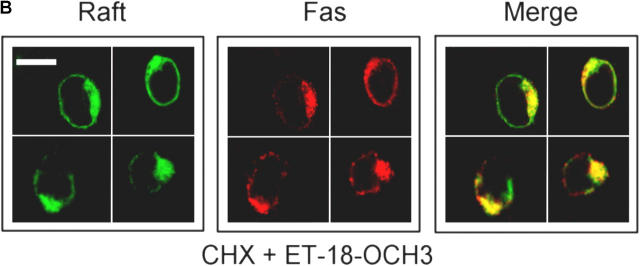
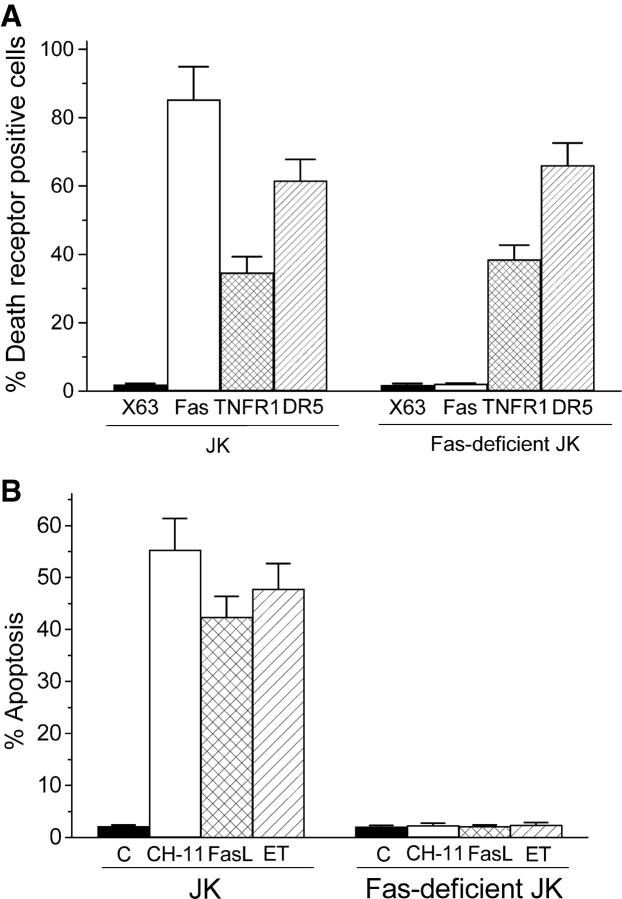
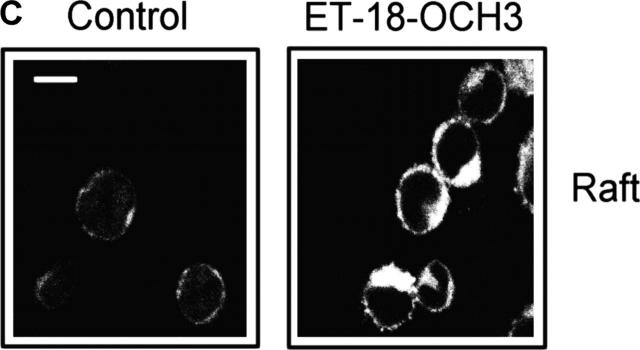
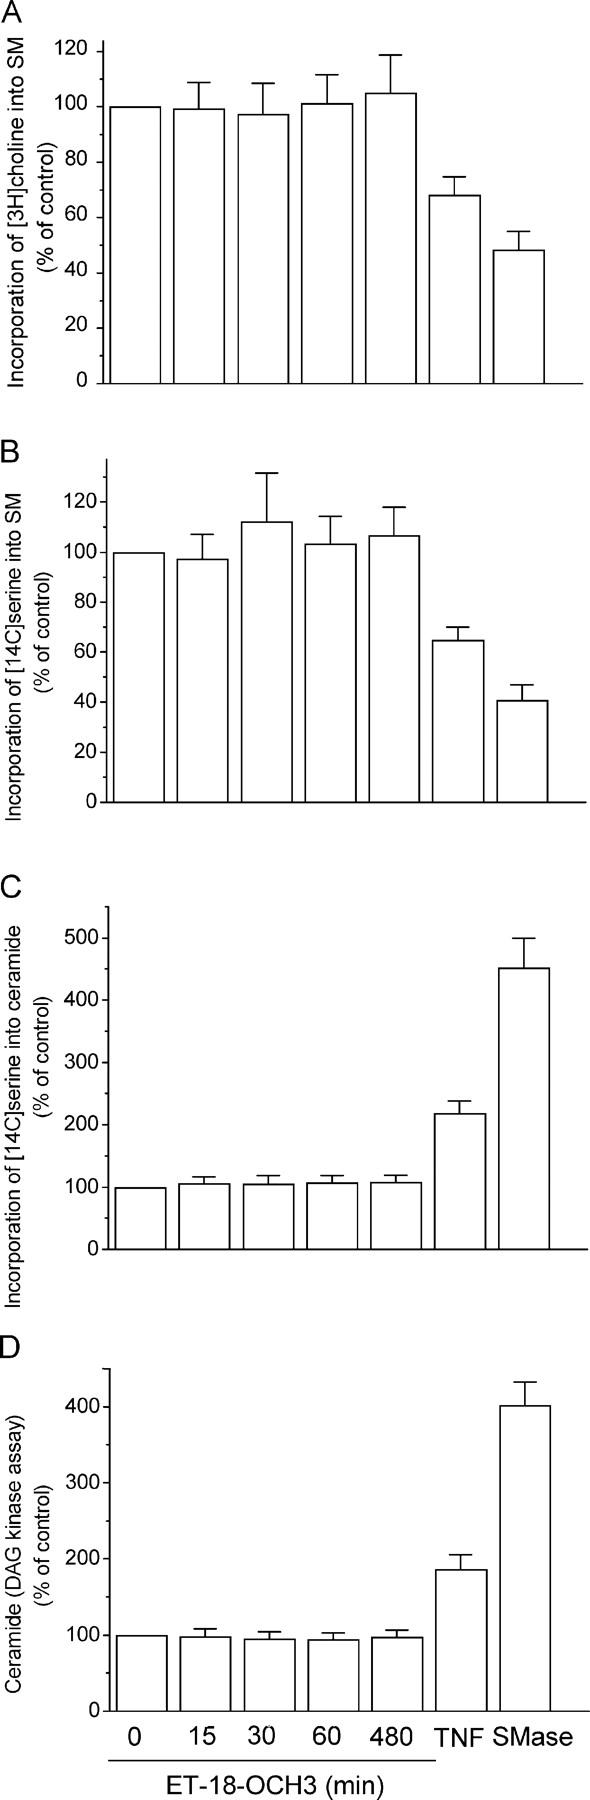
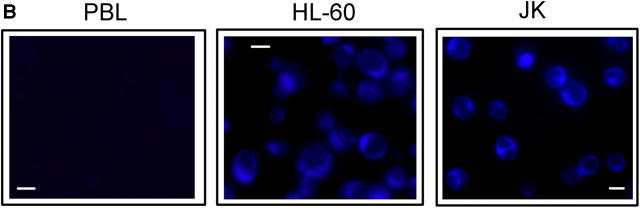
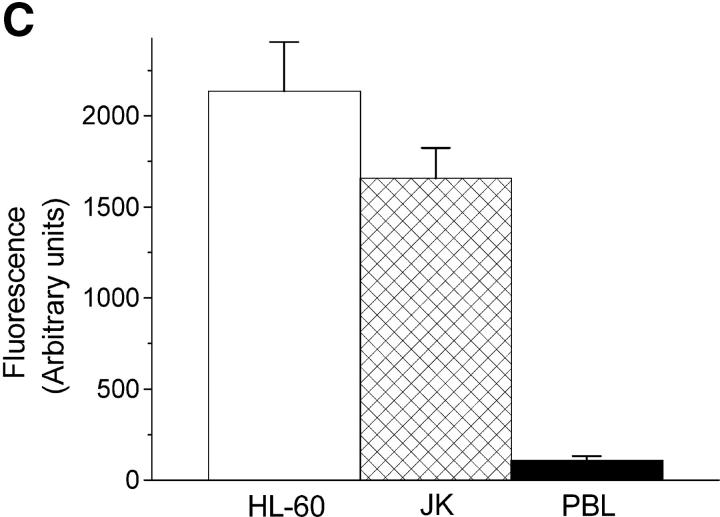
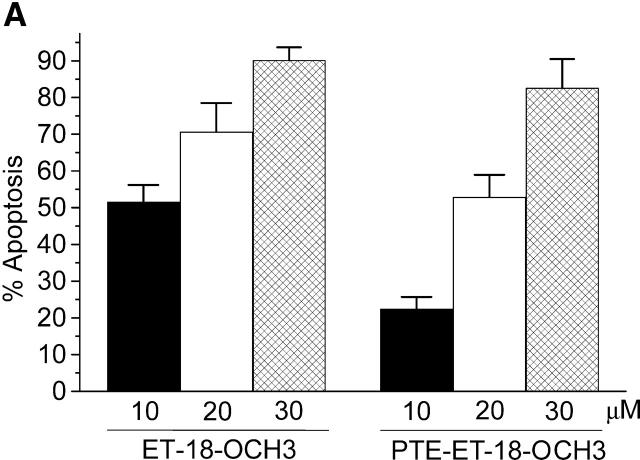
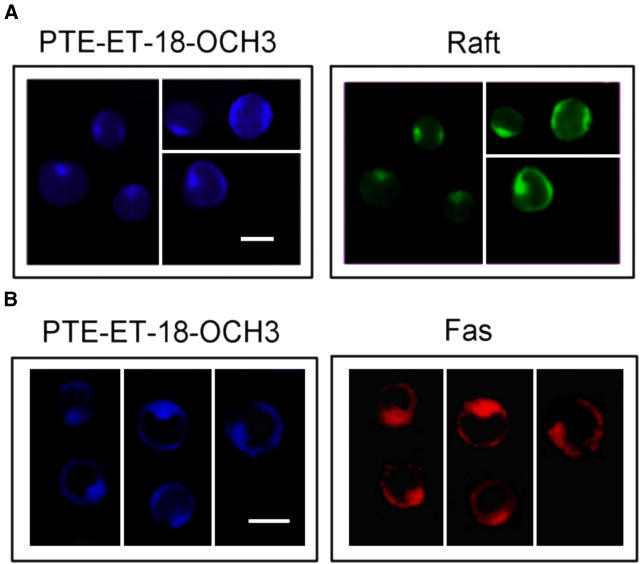
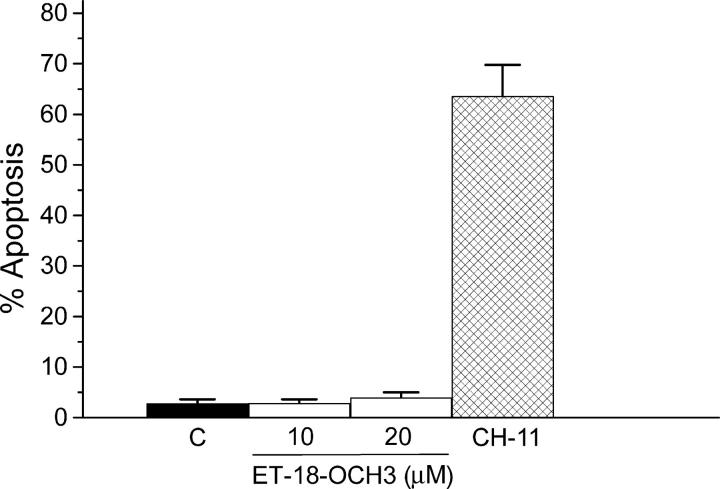
We have discovered a new and specific cell-killing mechanism mediated by the selective uptake of the antitumor drug 1-O-octadecyl-2-O-methyl-rac-glycero-3-phosphocholine (ET-18-OCH(3), Edelfosine) into lipid rafts of tumor cells, followed by its coaggregation with Fas death receptor (also known as APO-1 or CD95) and recruitment of apoptotic molecules into Fas-enriched rafts. Drug sensitivity was dependent on drug uptake and Fas expression, regardless of the presence of other major death receptors, such as tumor necrosis factor (TNF) receptor 1 or TNF-related apoptosis-inducing ligand R2/DR5 in the target cell. Drug microinjection experiments in Fas-deficient and Fas-transfected cells unable to incorporate exogenous ET-18-OCH(3) demonstrated that Fas was intracellularly activated. Partial deletion of the Fas intracellular domain prevented apoptosis. Unlike normal lymphocytes, leukemic T cells incorporated ET-18-OCH(3) into rafts coaggregating with Fas and underwent apoptosis. Fas-associated death domain protein, procaspase-8, procaspase-10, c-Jun amino-terminal kinase, and Bid were recruited into rafts, linking Fas and mitochondrial signaling routes. Clustering of rafts was necessary but not sufficient for ET-18-OCH(3)-mediated cell death, with Fas being required as the apoptosis trigger. ET-18-OCH(3)-mediated apoptosis did not require sphingomyelinase activation. Normal cells, including human and rat hepatocytes, did not incorporate ET-18-OCH(3) and were spared. This mechanism represents the first selective activation of Fas in tumor cells. Our data set a framework for the development of more targeted therapies leading to intracellular Fas activation and recruitment of downstream signaling molecules into Fas-enriched rafts.


Figures

Figure 1.
Figure 1.
Intracellular Fas activation in ET-18-OCH3–mediated apoptosis. L929, L929-Fas, and L929-FasΔ57C cells were assayed by flow cytometry for their respective cell surface content of Fas using anti-Fas SM1/1 mAb (A), and for the ability of 100 U/ml murine TNF-α (TNF), 50 ng/ml rhTRAIL, 100 ng/ml rhFasL, and 50 ng/ml cytotoxic anti-Fas CH-11 mAb to induce apoptosis after a 24-h incubation in the presence of 500 ng/ml actinomycin D (B). Untreated control cells (Control) were run in parallel. Data shown are means ± SD of three independent determinations. (C) Apoptosis was determined by TUNEL analysis in L929, L929-Fas, and L929-FasΔ57C cells after microinjection of rhodamine-labeled dextran alone (Control), used to visualize the microinjected cells by red fluorescence, or in combination with ET-18-OCH3 (ET-18-OCH3). Microinjected cells are identified by cytoplasmic red staining, and apoptotic nuclei are visualized by the TUNEL reaction in green. Images shown are representative of four independent experiments. Bar, 10 μm.
Figure 1.
Figure 1.
Intracellular Fas activation in ET-18-OCH3–mediated apoptosis. L929, L929-Fas, and L929-FasΔ57C cells were assayed by flow cytometry for their respective cell surface content of Fas using anti-Fas SM1/1 mAb (A), and for the ability of 100 U/ml murine TNF-α (TNF), 50 ng/ml rhTRAIL, 100 ng/ml rhFasL, and 50 ng/ml cytotoxic anti-Fas CH-11 mAb to induce apoptosis after a 24-h incubation in the presence of 500 ng/ml actinomycin D (B). Untreated control cells (Control) were run in parallel. Data shown are means ± SD of three independent determinations. (C) Apoptosis was determined by TUNEL analysis in L929, L929-Fas, and L929-FasΔ57C cells after microinjection of rhodamine-labeled dextran alone (Control), used to visualize the microinjected cells by red fluorescence, or in combination with ET-18-OCH3 (ET-18-OCH3). Microinjected cells are identified by cytoplasmic red staining, and apoptotic nuclei are visualized by the TUNEL reaction in green. Images shown are representative of four independent experiments. Bar, 10 μm.
Figure 2.
Figure 2.
ET-18-OCH3–induced clustering of Fas, but not of TNFR1, in human leukemic cells. Jurkat cells were either untreated (Control) or treated with 10 μM ET-18-OCH3 for 6 h, and then stained with FITC-CTx B subunit to identify rafts (green fluorescence) and with specific antibodies followed by CY3-conjugated antibodies (red fluorescence) to identify Fas (A) or TNFR1 (B). Areas of colocalization between membrane rafts and the indicated proteins in the merge panels are yellow. Images shown are representative of three independent experiments. Bar, 10 μm.
Figure 3.
Figure 3.
Recruitment of Fas and downstream signaling molecules into membrane rafts after ET-18-OCH3 treatment. Untreated Jurkat cells (Control) and Jurkat cells treated with 10 μM ET-18-OCH3 (ET-18-OCH3) for 6 h were lysed in 1% Triton X-100 and subjected to discontinuous sucrose density gradient centrifugation. Individual fractions were subjected to SDS-PAGE and Western blotting. Location of GM1-containing rafts (fractions 3–6) was determined using CTx B subunit conjugated to horseradish peroxidase. Location of the indicated receptors and signaling proteins were examined using specific antibodies. Active p18 caspase-8 and p23 caspase-10 cleavage forms are indicated. Representative blots of three separate experiments are shown.
Figure 4.
Figure 4.
Clustering of Fas is independent of protein synthesis. (A) Cell surface expression of Fas was determined by immunofluorescence flow cytometry in untreated Jurkat cells (Control) and cells treated with 10 μM ET-18-OCH3 for 6 h. Data shown are means ± SD of three independent experiments. (B) Jurkat cells, preincubated with 5 μM cycloheximide (CHX) for 1 h and then treated with 10 μM ET-18-OCH3 for 6 h, were stained with FITC-CTx B subunit (green fluorescence for rafts) and anti-Fas mAb, followed by CY3-conjugated anti–mouse antibody (red fluorescence for Fas). Areas of colocalization between membrane rafts and Fas in the merge panels are yellow. Images shown are representative of three independent experiments. Bar, 10 μm.
Figure 4.
Figure 4.
Clustering of Fas is independent of protein synthesis. (A) Cell surface expression of Fas was determined by immunofluorescence flow cytometry in untreated Jurkat cells (Control) and cells treated with 10 μM ET-18-OCH3 for 6 h. Data shown are means ± SD of three independent experiments. (B) Jurkat cells, preincubated with 5 μM cycloheximide (CHX) for 1 h and then treated with 10 μM ET-18-OCH3 for 6 h, were stained with FITC-CTx B subunit (green fluorescence for rafts) and anti-Fas mAb, followed by CY3-conjugated anti–mouse antibody (red fluorescence for Fas). Areas of colocalization between membrane rafts and Fas in the merge panels are yellow. Images shown are representative of three independent experiments. Bar, 10 μm.
Figure 5.
Figure 5.
Clustering of Fas-deficient rafts is not sufficient for apoptosis. (A) Cell surface expression of Fas, TNFR1, and DR5 in Jurkat (JK) and Fas-deficient Jurkat cells was determined by flow cytometry. Percent of positive cells for each death receptor was estimated using the P3X63 (X63) myeloma culture supernatant as negative control. (B) Induction of apoptosis in Jurkat (JK) and Fas-deficient Jurkat cells was determined by flow cytometry after a 24-h incubation with 50 ng/ml cytotoxic anti-Fas CH-11 mAb, 100 ng/ml rhFasL (FasL), or 10 μM ET-18-OCH3 (ET). Untreated control cells (C) were run in parallel. Data shown are means ± SD of three independent experiments. (C) Fas-deficient Jurkat cells were untreated (Control) or incubated with 10 μM ET-18-OCH3 (ET-18-OCH3) for 6 h, and then stained with FITC-CTx B subunit and analyzed by confocal microscopy to visualize membrane rafts. Images shown are representative of three independent experiments. Bar, 10 μm.
Figure 5.
Figure 5.
Clustering of Fas-deficient rafts is not sufficient for apoptosis. (A) Cell surface expression of Fas, TNFR1, and DR5 in Jurkat (JK) and Fas-deficient Jurkat cells was determined by flow cytometry. Percent of positive cells for each death receptor was estimated using the P3X63 (X63) myeloma culture supernatant as negative control. (B) Induction of apoptosis in Jurkat (JK) and Fas-deficient Jurkat cells was determined by flow cytometry after a 24-h incubation with 50 ng/ml cytotoxic anti-Fas CH-11 mAb, 100 ng/ml rhFasL (FasL), or 10 μM ET-18-OCH3 (ET). Untreated control cells (C) were run in parallel. Data shown are means ± SD of three independent experiments. (C) Fas-deficient Jurkat cells were untreated (Control) or incubated with 10 μM ET-18-OCH3 (ET-18-OCH3) for 6 h, and then stained with FITC-CTx B subunit and analyzed by confocal microscopy to visualize membrane rafts. Images shown are representative of three independent experiments. Bar, 10 μm.
Figure 6.
Figure 6.
Lack of SMase activation and ceramide generation by ET-18-OCH3. Jurkat cells were labeled with [methyl-3H]choline and L-[14C]serine, and then treated with 10 μM ET-18-OCH3 for the indicated time points. The incorporation of [methyl-3H]choline and L-[14C]serine into sphingomyelin (SM) (A and B) and the incorporation of L-[14C]serine into ceramide (C) was determined as a percentage to untreated control cells. Ceramide content was also calculated by the diacylglycerol (DAG) kinase assay (D). Jurkat cells treated with 500 U/ml TNF-α (TNF) for 30 min or with 0.3 U/ml Staphylococcus aureus SMase for 1 h were used as positive controls. Data shown are means ± SD of three independent determinations.
Figure 7.
Figure 7.
Selective incorporation of the fluorescent analogue PTE-ET-18-OCH3 in human leukemic cells. Human leukemic Jurkat cells were incubated with the indicated concentrations of ET-18-OCH3 or PTE-ET-18-OCH3 for 24 h and apoptosis was measured by flow cytometry (A). Normal PBLs and leukemic HL-60 and Jurkat cells (JK) were treated with 20 μM PTE-ET-18-OCH3 for 7 h, washed with 1% BSA-PBS, and fluorescent drug uptake was analyzed by fluorescence microscopy (blue fluorescence) (B) or by fluorescence quantitation (C). Data shown are means ± SD of three independent determinations.
Figure 7.
Figure 7.
Selective incorporation of the fluorescent analogue PTE-ET-18-OCH3 in human leukemic cells. Human leukemic Jurkat cells were incubated with the indicated concentrations of ET-18-OCH3 or PTE-ET-18-OCH3 for 24 h and apoptosis was measured by flow cytometry (A). Normal PBLs and leukemic HL-60 and Jurkat cells (JK) were treated with 20 μM PTE-ET-18-OCH3 for 7 h, washed with 1% BSA-PBS, and fluorescent drug uptake was analyzed by fluorescence microscopy (blue fluorescence) (B) or by fluorescence quantitation (C). Data shown are means ± SD of three independent determinations.
Figure 8.
Figure 8.
Accumulation of the fluorescent analogue PTE-ET-18-OCH3 in Fas-enriched raft caps in leukemic cells. Jurkat cells were incubated with 20 μM PTE-ET-18-OCH3 (blue fluorescence) for 6 h, and then its colocalization with membrane rafts (A) and Fas (B) was examined using FITC-CTx B subunit (green fluorescence for rafts) and anti-Fas SM1/1 mAb, followed by CY3-conjugated anti–mouse antibody (red fluorescence for Fas). Images shown are representative of four independent experiments. Bar, 10 μm.
Figure 9.
Figure 9.
ET-18-OCH3 spares normal human hepatocytes. Human hepatocytes were untreated (C) or treated with 200 ng/ml cytotoxic anti-Fas CH-11 mAb or with 10 or 20 μM ET-18-OCH3 for 24 h, and then apoptosis was determined by flow cytometry. Data shown are means ± SD of three independent determinations.

Similar articles

Cited by

References

    1. Munder, P.G., and O. Westphal. 1990. Antitumoral and other biomedical activities of synthetic ether lysophospholipids. Chem. Immunol. 49:206–235. - PubMed
    1. Houlihan, W.J., M. Lohmeyer, P. Workman, and S.H. Cheon. 1995. Phospholipid antitumor agents. Med. Res. Rev. 15:157–223. - PubMed
    1. Gajate, C., and F. Mollinedo. 2002. Biological activities, mechanisms of action and biomedical prospect of the antitumor ether phospholipid ET-18-OCH(3) (edelfosine), a proapoptotic agent in tumor cells. Curr. Drug Metab. 3:491–525. - PubMed
    1. Jendrossek, V., and R. Handrick. 2003. Membrane targeted anticancer drugs: potent inducers of apoptosis and putative radiosensitisers. Curr. Med. Chem. Anti-Canc. Agents. 3:343–353. - PubMed
    1. Mollinedo, F., J.L. Fernandez-Luna, C. Gajate, B. Martin-Martin, A. Benito, R. Martinez-Dalmau, and M. Modolell. 1997. Selective induction of apoptosis in cancer cells by the ether lipid ET-18-OCH3 (edelfosine): molecular structure requirements, cellular uptake, and protection by Bcl-2 and Bcl-X(L). Cancer Res. 57:1320–1328. - PubMed

Publication types