. 2004 Aug 10;101(32):11531-6.
doi: 10.1073/pnas.0404656101. Epub 2004 Aug 2.

Evolvability is a selectable trait

Affiliations

Evolvability is a selectable trait

David J Earl et al. Proc Natl Acad Sci U S A. .

Abstract

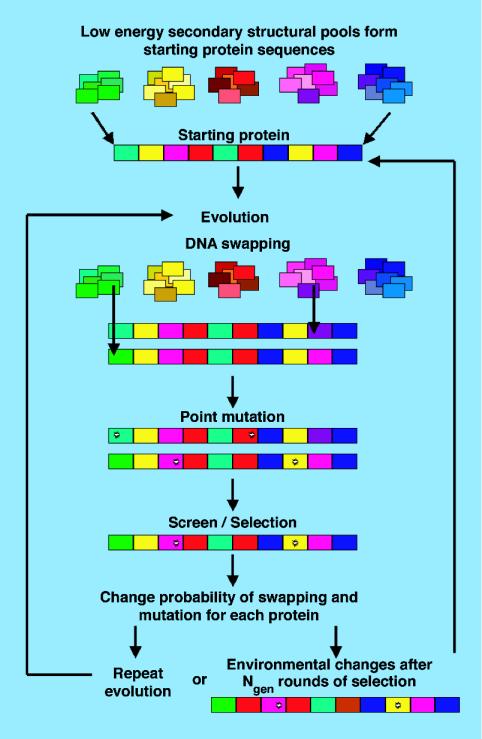
Concomitant with the evolution of biological diversity must have been the evolution of mechanisms that facilitate evolution, because of the essentially infinite complexity of protein sequence space. We describe how evolvability can be an object of Darwinian selection, emphasizing the collective nature of the process. We quantify our theory with computer simulations of protein evolution. These simulations demonstrate that rapid or dramatic environmental change leads to selection for greater evolvability. The selective pressure for large-scale genetic moves such as DNA exchange becomes increasingly strong as the environmental conditions become more uncertain. Our results demonstrate that evolvability is a selectable trait and allow for the explanation of a large body of experimental results.


Figures

Fig. 1.
Fig. 1.
Schematic diagram showing the evolution of the protein system.
Fig. 2.
Fig. 2.
nmut (dashed lines) and pswap (solid lines) as a function of the frequency of environmental change, 1/Ngen, for different values of the severity of environmental change, p. The statistical errors in the results are smaller than the symbols on the figure.
Fig. 3.
Fig. 3.
Hamming distance and average variance. (a) Hamming distance as a function of the severity of environmental change, p, for the state points shown in Fig. 2. (b) Hamming distance as a function of nmut (dashed lines) and pswap (solid lines) for fixed Ngen = 15 and for different severities of environmental change, p. In displaying the Hamming distance dependence on nmut (pswap), we fix pswap (nmut) to the selected values from Fig. 2. The selected values of nmut and pswap at each state point are shown by light and dark circles, respectively. (c) Average variance, σ2Uend, of the energy of a population at the end of an evolution, Uend, as a function of the severity of environmental change, p, for different frequencies of environmental change, 1/Ngen.
Fig. 4.
Fig. 4.
Average energy, average change in energy, and probability distribution. (a) Average energy immediately after, 〈Ustart, and immediately before, 〈Uend, an environmental change as a function of the severity of environmental change, p, for different frequencies of environmental change. (b) Average change in energy, 〈ΔU〉, multiplied by the frequency of environmental change, 1/Ngen, as a function of the severity of environmental change, p. (c) Probability distribution of the susceptibility for different values of the severity of environmental change, p, for a fixed frequency of environmental change, 1/Ngen = 0.1.

References

    1. Gould, S. J. (1983) Hen's Teeth and Horse's Toes (Norton, New York).
    1. Kirschner, M. & Gerhart, J. (1998) Proc. Natl. Acad. Sci. USA 95, 8420–8427. - PMC - PubMed
    1. Dawkins, R. (1989) in Artificial Life, ed. Langton, C. G. (Addison–Wesley, New York), pp. 201–220.
    1. Radman, M., Matic, I. & Taddei, F. (1999) Ann. N.Y. Acad. Sci. 870, 146–155. - PubMed
    1. Chicurel, M. (2001) Science 292, 1824–1827. - PubMed

Publication types