

High-throughput sensing and noninvasive imaging of protein nuclear transport by using reconstitution of split Renilla luciferase
- PMID: 15289615
- PMCID: PMC511017
- DOI: 10.1073/pnas.0401722101
High-throughput sensing and noninvasive imaging of protein nuclear transport by using reconstitution of split Renilla luciferase
Abstract
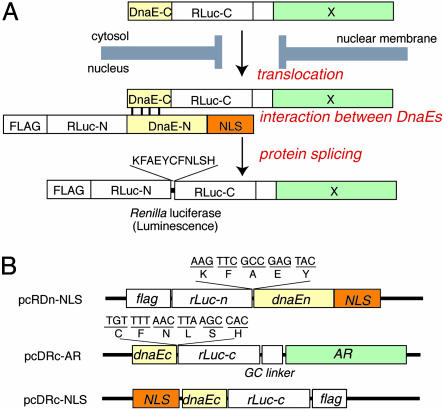
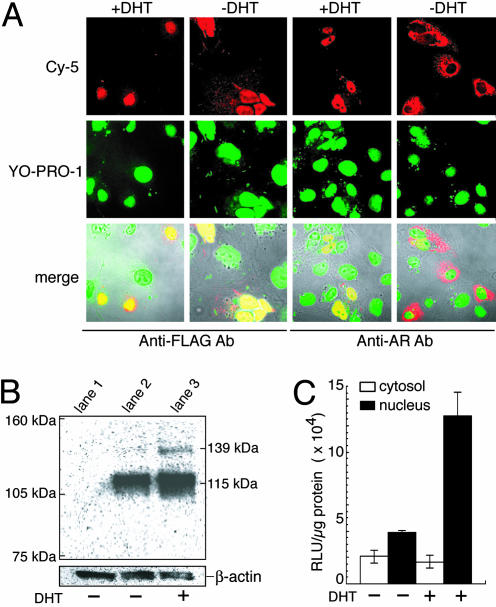
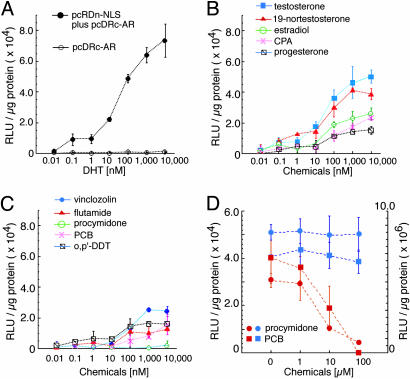
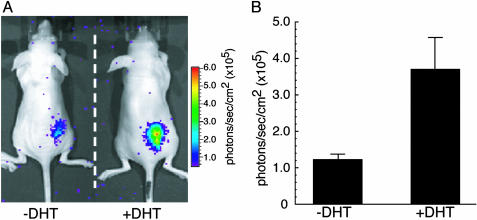
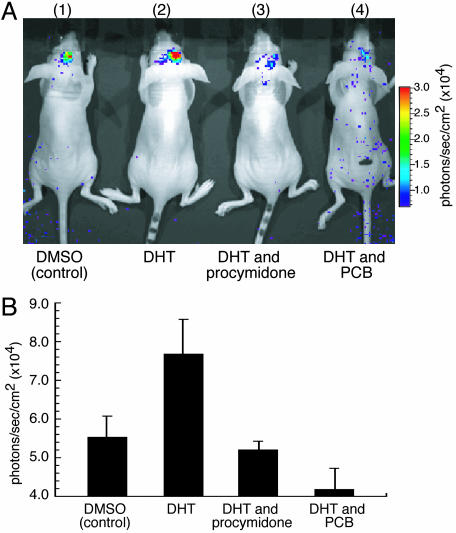
Nucleocytoplasmic trafficking of functional proteins plays a key role in regulating gene expressions in response to extracellular signals. We developed a genetically encoded bioluminescent indicator for monitoring the nuclear trafficking of target proteins in vitro and in vivo. The principle is based on reconstitution of split fragments of Renilla reniformis (Rluc) by protein splicing with a DnaE intein (a catalytic subunit of DNA polymerase III). A target cytosolic protein fused to the N-terminal half of Rluc is expressed in mammalian cells. If the protein translocates into the nucleus, the Rluc moiety meets the C-terminal half of Rluc, and full-length Rluc is reconstituted by protein splicing. We demonstrated quantitative cell-based in vitro sensing of ligand-induced translocation of androgen receptor, which allowed high-throughput screening of exo- and endogenous agonists and antagonists. Furthermore, the indicator enabled noninvasive in vivo imaging of the androgen receptor translocation in the brains of living mice with a charge-coupled device imaging system. These rapid and quantitative analyses in vitro and in vivo provide a wide variety of applications for screening pharmacological or toxicological compounds and testing them in living animals.
Figures
Similar articles
-
Quantitative determination of protein nuclear transport induced by phosphorylation or by proteolysis.Anal Chem. 2005 Nov 1;77(21):6928-34. doi: 10.1021/ac050966z. Anal Chem. 2005. PMID: 16255591
-
Genetically encoded stress indicator for noninvasively imaging endogenous corticosterone in living mice.Anal Chem. 2005 Oct 15;77(20):6588-93. doi: 10.1021/ac0510078. Anal Chem. 2005. PMID: 16223244
-
Genetically encoded optical probe for detecting release of proteins from mitochondria toward cytosol in living cells and mammals.Anal Chem. 2006 Dec 1;78(23):8076-81. doi: 10.1021/ac061488a. Anal Chem. 2006. PMID: 17134142
-
Genetically encoded optical probes for imaging cellular signaling pathways.Biosens Bioelectron. 2005 Jun 15;20(12):2504-11. doi: 10.1016/j.bios.2004.10.015. Epub 2004 Dec 10. Biosens Bioelectron. 2005. PMID: 15854822 Review.
-
Protein reconstitution methods for visualizing biomolecular function in living cells.Yakugaku Zasshi. 2009 Mar;129(3):289-95. doi: 10.1248/yakushi.129.289. Yakugaku Zasshi. 2009. PMID: 19252386 Review.
Cited by
-
Firefly luciferase enzyme fragment complementation for imaging in cells and living animals.Anal Chem. 2005 Mar 1;77(5):1295-302. doi: 10.1021/ac0484777. Anal Chem. 2005. PMID: 15732910 Free PMC article.
-
Reporter gene imaging of protein-protein interactions in living subjects.Curr Opin Biotechnol. 2007 Feb;18(1):31-7. doi: 10.1016/j.copbio.2007.01.007. Epub 2007 Jan 24. Curr Opin Biotechnol. 2007. PMID: 17254764 Free PMC article. Review.
-
Firefly Luciferase Complementation-Based Analysis of Dynamic Protein-Protein Interactions Under Diurnal and Circadian Conditions in Arabidopsis.Methods Mol Biol. 2022;2398:205-213. doi: 10.1007/978-1-0716-1912-4_16. Methods Mol Biol. 2022. PMID: 34674178
-
Human Metapneumovirus M2-2 Protein Acts as a Negative Regulator of Alpha Interferon Production by Plasmacytoid Dendritic Cells.J Virol. 2017 Sep 27;91(20):e00579-17. doi: 10.1128/JVI.00579-17. Print 2017 Oct 15. J Virol. 2017. PMID: 28768858 Free PMC article.
-
Diversity in genetic in vivo methods for protein-protein interaction studies: from the yeast two-hybrid system to the mammalian split-luciferase system.Microbiol Mol Biol Rev. 2012 Jun;76(2):331-82. doi: 10.1128/MMBR.05021-11. Microbiol Mol Biol Rev. 2012. PMID: 22688816 Free PMC article. Review.
References
-
- Kau, T. R. & Silver, P. A. (2003) Drug Discov. Today 8, 78–85. - PubMed
-
- Kau, T. R., Way, J. C. & Silver, P. A. (2004) Nat. Rev. Cancer 4, 106–117. - PubMed
-
- Rudin, M. & Weissleder, R. (2003) Nat. Rev. Drug Discov. 2, 123–131. - PubMed
-
- Gray, L. E., Jr., Ostby, J., Wilson, V., Lambright, C., Bobseine, K., Hartig, P., Hotchkiss, A., Wolf, C., Furr, J., Price, M., et al. (2002) Toxicology 181–182, 371–382. - PubMed
-
- Elion, E. A. (2002) Methods Enzymol. 351, 607–622. - PubMed
Publication types
MeSH terms
Substances
LinkOut - more resources
Full Text Sources
Other Literature Sources
Medical
