. 2004 Aug 3;32(13):3977-83.
doi: 10.1093/nar/gkh731. Print 2004.

The Alternative Splicing Gallery (ASG): bridging the gap between genome and transcriptome

Affiliations

The Alternative Splicing Gallery (ASG): bridging the gap between genome and transcriptome

Jeremy Leipzig et al. Nucleic Acids Res. .

Abstract

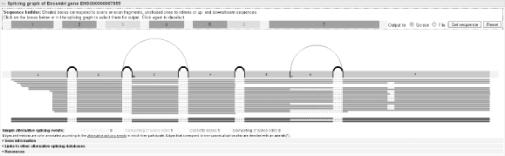
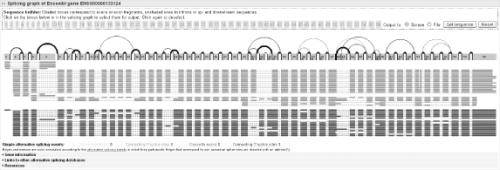
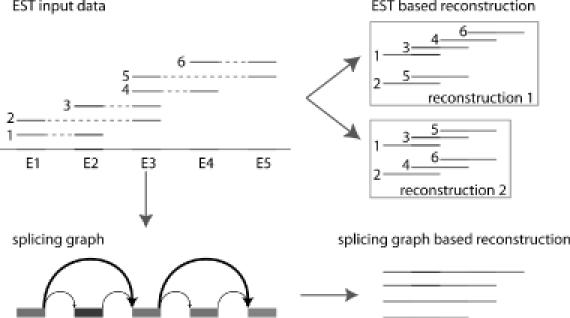
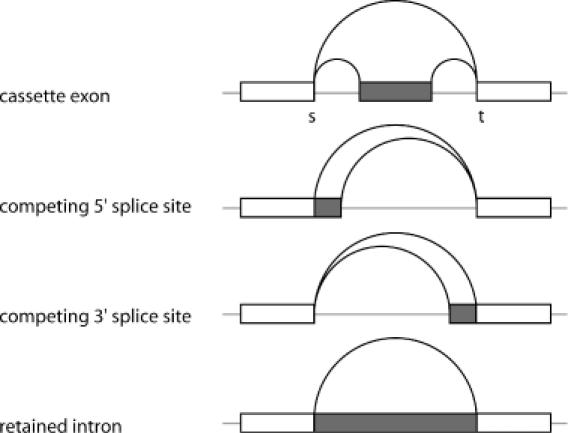
Alternative splicing essentially increases the diversity of the transcriptome and has important implications for physiology, development and the genesis of diseases. Conventionally, alternative splicing is investigated in a case-by-case fashion, but this becomes cumbersome and error prone if genes show a huge abundance of different splice variants. We use a different approach and integrate all transcripts derived from a gene into a single splicing graph. Each transcript corresponds to a path in the graph, and alternative splicing is displayed by bifurcations. This representation preserves the relationships between different splicing variants and allows us to investigate systematically all possible putative transcripts. We built a database of splicing graphs for human genes, using transcript information from various major sources (Ensembl, RefSeq, STACK, TIGR and UniGene). A Web interface allows users to display the splicing graphs, to interactively assemble transcripts and to access their sequences as well as neighboring genomic regions. We also provide for each gene an exhaustive pre-computed catalog of putative transcripts--in total more than 1.2 million sequences. We found that approximately 65% of the investigated genes show evidence for alternative splicing, and in 5% of the cases, a single gene might produce over 100 transcripts.


Figures

Figure 1
Figure 1
Visualization of the splicing graph (gray) of the human CBFB gene with Ensembl gene identifier: ENSG00000067955 together with the corresponding aligned input transcripts (green) and representative transcript reconstructions (purple). Not drawn to scale! Splice sites are marked by vertical bars. Color-labeled vertices mark annotated alternative splicing events. The highlighted boxes in the sequence builder depict a transcript that skips exon 3 and uses an alternative 5′ splice site in exon 5. Transcripts are displayed with respect to their alignment with the genomic sequence as rows of boxes (aligned regions) connected by dotted lines (putative introns). Only alignments that meet our quality constraints (alignment boundaries correspond to splice sites, sequence identity >95%) are incorporated in the splicing graph.
Figure 2
Figure 2
Visualization of the splicing graph (gray) of the human COL4A6 gene with Ensembl gene identifier ENSG00000133124 together with the corresponding aligned input transcripts (green). Not drawn to scale!
Figure 3
Figure 3
In the presence of alternative splicing, conventional EST-based transcript reconstruction is often incomplete. For example, given the set of displayed ESTs, there are two different ways of assembling (partitioning) all input ESTs into consensus sequences. Both reconstructions are equally computable from the data and explain all ESTs, but each one consists of only two sequences. Dependent on the order of the processed ESTs, a conventional approach might result in either reconstruction and miss the other. In contrast, a splicing graph-based approach does not partition the data but reports exhaustively all four different putative transcripts. However, in the presence of dependences between alternative splicing events, this approach runs the risk of overpredictions by grouping together splicing events that might not co-occur in nature.
Figure 4
Figure 4
Types of alternative splicing annotated in the splicing graph gallery. Boxes represent exons or exon fragments. Retained introns are often caused by incompletely spliced ESTs and should be interpreted very carefully.

References

    1. Mironov A., Fickett,J. and Gelfand,M. (1999) Frequent alternative splicing of human genes. Genome Res., 9, 1288–1293. - PMC - PubMed
    1. Modrek B. and Lee,C. (2001) A genomic view of alternative splicing. Nature Genet., 30, 13–19. - PubMed
    1. Graveley B. (2001) Alternative splicing: increasing diversity in the proteomic world. Trends Genet., 17, 100–107. - PubMed
    1. Wheeler D., Church,D., Federhen,S., Lash,A., Madden,T., Pontius,J., Schuler,G., Schriml,L., Sequeira,E., Tatusova,T. and Wagner,L. (2003) Database resources of the National Center for Biotechnology. Nucleic Acids Res., 31, 28–33. - PMC - PubMed
    1. Quackenbush J., Cho,J., Lee,D., Liang,F., Holt,I., Karamycheva,S., Parvizi,B., Pertea,G., Sultana,R. and White,J. (2001) The TIGR Gene Indices: analysis of gene transcript sequences in highly sampled eukaryotic species. Nucleic Acids Res., 29, 159–164. - PMC - PubMed

Substances