. 2004 Aug 16;91(4):745-52.
doi: 10.1038/sj.bjc.6602048.

Correlation of in vitro infiltration with glioma histological type in organotypic brain slices

Affiliations

Correlation of in vitro infiltration with glioma histological type in organotypic brain slices

S Palfi et al. Br J Cancer. .

Abstract

Diffuse invasion of the brain, an intrinsic property of gliomas, renders these tumours incurable, and is a principal determinant of their spatial and temporal growth. Knowledge of the invasive potential of gliomas is highly desired in order to understand their behaviour in vivo. Comprehensive ex vivo invasion studies including tumours of different histological types and grades are however lacking, mostly because reliable physiological invasion assays have been difficult to establish. Using an organotypic rodent brain slice assay, we evaluated the invasiveness of 42 grade II-IV glioma biopsy specimens, and correlated it with the histological phenotype, the absence or presence of deletions on chromosomes 1p and 19q assessed by fluorescent in situ hybridisation, and proliferation and apoptosis indices assessed by immunocytochemistry. Oligodendroglial tumours with 1p/19q loss were less invasive than astrocytic tumours of similar tumour grade. Correlation analysis of invasiveness cell proliferation and apoptosis further suggested that grade II-III oligodendroglial tumours with 1p/19q loss grow in situ as relatively circumscribed compact masses in contrast to the more infiltrative and more diffuse astrocytomas. Lower invasiveness may be an important characteristic of oligodendroglial tumours, adding to our understanding of their more indolent clinical evolution and responsiveness to therapy.


Figures
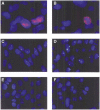
Figure 1
Figure 1
Nuclear (A) and cytoplasmic (B) active caspase 3 immunolabellings. For the purposes of this illustration, bound anti-caspase 3 primary antibody was detected by a biotinylated secondary antibody, an avidin–peroxidase complex (both from Vector), and the TSA cyanine 3 signal amplification system (PerkinElmer™, Boston, USA). Separately acquired images in the red and blue (DAPI) channels were subjected to a shading correction by subtracting from the original image its version blurred by a 50-fold application of a 46-size lowpass filter, and mildly deconvoluted using the iterative optical deconvolution module of KS400 3.0 with 10 itinerations of a maximum likelihood algorithm and suitable aperture values. 1p/1c (C,D) and 19q (E,F) showing representative fields of tumours without (C,E) and with (D,F) chromosomal losses. Note that, for the simultaneous identification of two probes (e.g. 1p/1c), nine patterns of labelling ranging from (0,0) to (2,2) are possible. All except (2,2) can be due to nuclear truncation. We attempted to control for these inevitable artefacts by applying the two methods outlined in Figure 2. To cut cytoplasmic background staining and to safely overamplify probe signals, FISH images represent field reconstructions of nuclei projected upon an artificial black background.
Figure 2
Figure 2
(A) 1p loss (1c: centromeric probe) in 39 gliomas: tumours with 1p/1c values below the mean–3s.d. threshold were considered to have 1p loss. Tumours with ratios below this threshold not marked with an asterisk (*) also had 19q loss. 1p loss was detected in 12 out of 19 oligodendroglial and in one out of 20 astrocytic tumours (P<0.0003); 1p/19q loss in nine out of 19 oligodendroglial and in zero out of 20 astrocytic tumours (P<0.0006). Four normal brain specimens were used to calculate the threshold. An example of a grade II Ol with a 1p/19q loss estimated by comparison of 1p signals with 1c signals in the same specimen (B), or of 19q signals with the mean 19q signal counts in the control group (C) (Kolmogorov–Smirnov test).
Figure 3
Figure 3
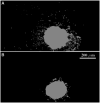
Examples of an invasive (A) and a practically noninvasive (B) tumour in a brain slice. Each of the two image montages is composed of six contiguous microscopic fields (× 100, 0.76 mm2). To avoid out-of-focus fluorescent glow and to facilitate tumour cell recognition, each image of glioma cells was separately segmented using grey morphology and adaptive thresholding algorithms (KS400 3.0), and the resulting binary image was overlaid in grey.
Figure 4
Figure 4
Representative examples of the three patterns of maximal cell density of invasion (C90) in grade IV tumours: high (200⩽C90⩽400 cells mm−2), intermediate (100⩽C90⩽200 cells mm−2), and low (C90⩽100 cells mm−2) within 0.5 mm from the implants. These three tumours showed comparable maximal distance of invasion (D90), but important differences in C90: D90 and C90 are two complementary estimates of invasion.
Figure 5
Figure 5
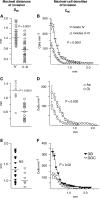
D90 and C90 according to tumour grade (A,B) and tumour type (C–F). D90 and C90 were lower for grade II and III than for grade IV tumours (A,B), for grade II and III Ols than for grade II and III As (C,D); grade IV GOCs had lower C90 than grade IV GBMs (F), but the difference in D90 (E) was not significant (Mann–Whitney test).
Figure 6
Figure 6
Factor scores of grade II and III As and Ols for the principal components extracted (Table 1): ‘vascular in situ proliferating’ (factor 1), ‘hypercellular and compact’ (factor 2), and ‘noninvasive, characteristic of tumours with 1p/19q loss’ (factor 3). Score for all the three factors were higher for Ols than for As (Mann–Whitney test).
Figure 7
Figure 7
MIB-1/caspase 3 ratios of gliomas of different grade (A) and type (B,C); three-dimensional plots – MIB-1/caspase 3 ratio (X), D90 (Y), C90 (Z-axis) – of grade II and III tumours (D) and grade IV tumours (E). (A) In situ proliferation increased with grade; (B) higher in situ proliferation potentials for Ols than for As and for GOCs than for GBMs were suggested for tumours studied in the invasion assay (Kruskal–Wallis test); (C) A larger series (n=69) confirmed that grade II and grade III Ols had higher MIB-1/caspase 3 ratios than As of the same grade (Mann–Whitney test); (D) factors that determine the growth pattern of gliomas delineate important differences between the invasive As and the in situ proliferating Ols (grade II and III). (E) Note that some GBMs have very low proliferative potentials, and presumably grow predominantly by infiltration: knowledge of the infiltrative potential of a glioma is probably as important as knowledge of its capacity to proliferate.

References

    1. Bigner SH, Matthews MR, Rasheed BK, Wiltshire RN, Friedman HS, Friedman AH, Stenzel TT, Dawes DM, McLendon RE, Bigner DD (1999) Molecular genetic aspects of oligodendrogliomas including analysis by comparative genomic hybridisation. Am J Pathol 155: 375–386 - PMC - PubMed
    1. Burgess PK, Kulesa PM, Murray JD, Alvord EC (1997) The interaction of growth rates and diffusion coefficients in a three-dimensional mathematical model of gliomas. J Neuropathol Exp Neurol 56: 704–713 - PubMed
    1. Chicoine MR, Silbergeld DL (1995) The in vitro motility of human gliomas increases with increasing grade of malignancy. Cancer 75: 2904–2909 - PubMed
    1. de Boüard S, Christov C, Guillamo JS, Kassar-Duchossoy L, Palfi S, Masset M, Cohen-Hagenauer O, Peschanski M, Lefrançois T (2002) Ivasion of human glioma biopsies in rodent brain slices: a quantitative analysis. J Neurosurg 97: 169–176 - PubMed
    1. Deckert M, Reifenberger G, Wechsler W (1989) Determination of the proliferative potential of human brain tumours using the monoclonal antibody Ki-67. J Cancer Res Clin Oncol 115: 179–188 - PubMed

Publication types