

Sample size, library composition, and genotypic diversity among natural populations of Escherichia coli from different animals influence accuracy of determining sources of fecal pollution
- PMID: 15294775
- PMCID: PMC492448
- DOI: 10.1128/AEM.70.8.4478-4485.2004
Sample size, library composition, and genotypic diversity among natural populations of Escherichia coli from different animals influence accuracy of determining sources of fecal pollution
Abstract
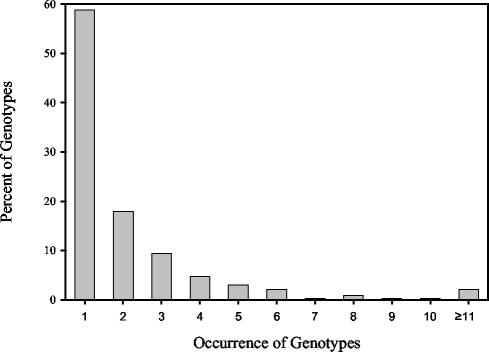
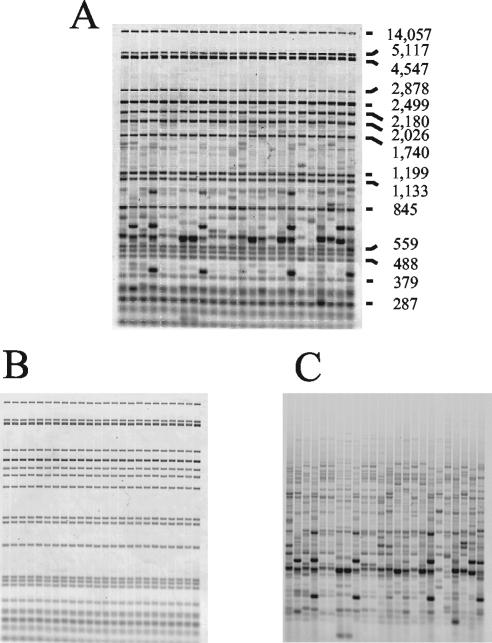
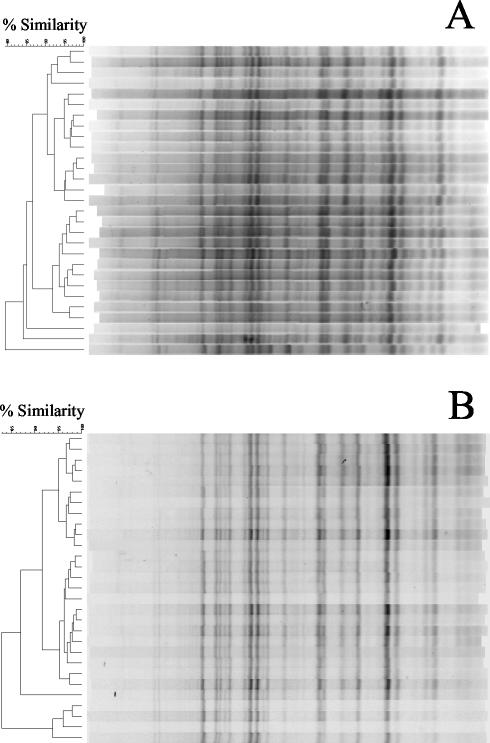
A horizontal, fluorophore-enhanced, repetitive extragenic palindromic-PCR (rep-PCR) DNA fingerprinting technique (HFERP) was developed and evaluated as a means to differentiate human from animal sources of Escherichia coli. Box A1R primers and PCR were used to generate 2,466 rep-PCR and 1,531 HFERP DNA fingerprints from E. coli strains isolated from fecal material from known human and 12 animal sources: dogs, cats, horses, deer, geese, ducks, chickens, turkeys, cows, pigs, goats, and sheep. HFERP DNA fingerprinting reduced within-gel grouping of DNA fingerprints and improved alignment of DNA fingerprints between gels, relative to that achieved using rep-PCR DNA fingerprinting. Jackknife analysis of the complete rep-PCR DNA fingerprint library, done using Pearson's product-moment correlation coefficient, indicated that animal and human isolates were assigned to the correct source groups with an 82.2% average rate of correct classification. However, when only unique isolates were examined, isolates from a single animal having a unique DNA fingerprint, Jackknife analysis showed that isolates were assigned to the correct source groups with a 60.5% average rate of correct classification. The percentages of correctly classified isolates were about 15 and 17% greater for rep-PCR and HFERP, respectively, when analyses were done using the curve-based Pearson's product-moment correlation coefficient, rather than the band-based Jaccard algorithm. Rarefaction analysis indicated that, despite the relatively large size of the known-source database, genetic diversity in E. coli was very great and is most likely accounting for our inability to correctly classify many environmental E. coli isolates. Our data indicate that removal of duplicate genotypes within DNA fingerprint libraries, increased database size, proper methods of statistical analysis, and correct alignment of band data within and between gels improve the accuracy of microbial source tracking methods.
Figures
References
-
- Albert, J. M., J. Munkata-Marr, L. Tenorio, and R. L. Siegrist. 2003. Statistical evaluation of bacterial source tracking data obtained by rep-PCR DNA fingerprinting of Escherichia coli. Environ. Sci. Technol. 37:4554-4560. - PubMed
-
- Burnes, B. S. 2003. Antibiotic resistance analysis of fecal coliforms to determine fecal pollution sources in a mixed-use watershed. Environ. Monit. Assess. 85:87-98. - PubMed
-
- de Bruijn, F. J. 1992. Use of repetitive (repetitive extragenic palindromic and enterobacterial repetitive intergeneric consensus) sequences and the polymerase chain reaction to fingerprint the genomes of Rhizobium meliloti isolates and other soil bacteria. Appl. Environ. Microbiol. 58:2180-2187. - PMC - PubMed
Publication types
MeSH terms
LinkOut - more resources
Full Text Sources
Medical
Miscellaneous
