

Influence of humic substances on bacterial and viral dynamics in freshwaters
- PMID: 15294823
- PMCID: PMC492460
- DOI: 10.1128/AEM.70.8.4848-4854.2004
Influence of humic substances on bacterial and viral dynamics in freshwaters
Abstract
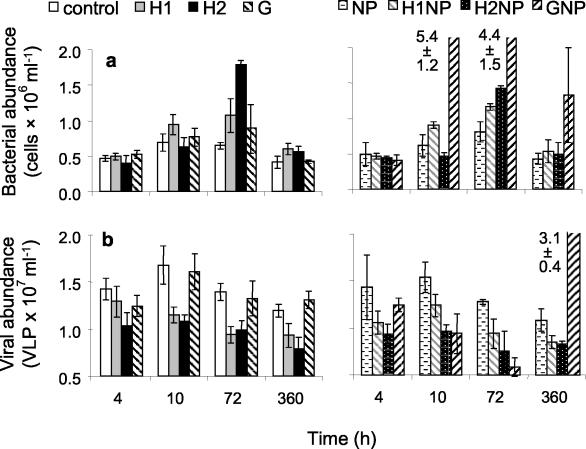
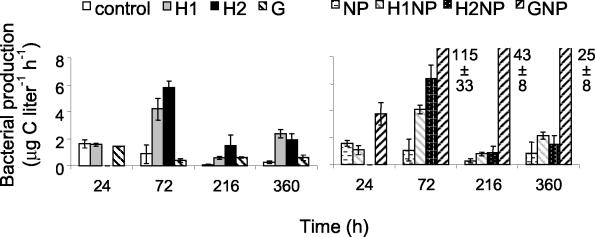
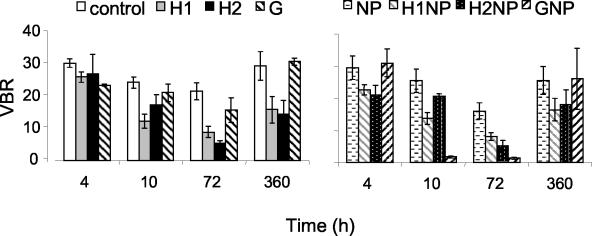
Bacterial and viral abundances were measured in 24 lakes with dissolved organic carbon (DOC) concentrations ranging from 3 to 19 mg of C liter(-1). In addition, a laboratory experiment was performed to test the effects of different sources of carbon (i.e., glucose and fulvic acids) and nutrients on the dynamics of viruses and bacteria. In the lake survey, no correlation was found between virus abundance and DOC concentration, yet there was a significant positive correlation between bacterial abundance and DOC concentration. A negative correlation was found between the virus-to-bacteria ratio and DOC level. These results are in agreement with our findings in the laboratory, where virus counts were significantly lower in treatments with fulvic acid additions than in a control (mean, 67.4% +/- 6.5% of the control). Virus counts did not differ significantly among the control and treatments with glucose, indicating that it was the type of organic carbon and not quantity which had an impact on viruses. Results from this study suggest that the way viruses control bacterial assemblages in humic lakes is different from the mechanism in clear water systems.
Figures
References
-
- Bergh, Ø., K. Y. Børsheim, G. Bratbak, and M. Heldal. 1989. High abundance of viruses found in aquatic environments. Nature 340:467-468. - PubMed
-
- Cochlan, W. P., J. Wikner, G. F. Steward, D. C. Smith, and F. Azam. 1993. Spatial distribution of viruses, bacteria, and chlorophyll a in neritic, oceanic and estuarine environments. Mar. Ecol. Prog. Ser. 92:77-87.
Publication types
MeSH terms
Substances
LinkOut - more resources
Full Text Sources
