. 2004 Aug;70(8):4950-60.
doi: 10.1128/AEM.70.8.4950-4960.2004.

Correspondence between community structure and function during succession in phenol- and phenol-plus-trichloroethene-fed sequencing batch reactors

Affiliations

Correspondence between community structure and function during succession in phenol- and phenol-plus-trichloroethene-fed sequencing batch reactors

Héctor L Ayala-Del-Río et al. Appl Environ Microbiol. 2004 Aug.

Abstract

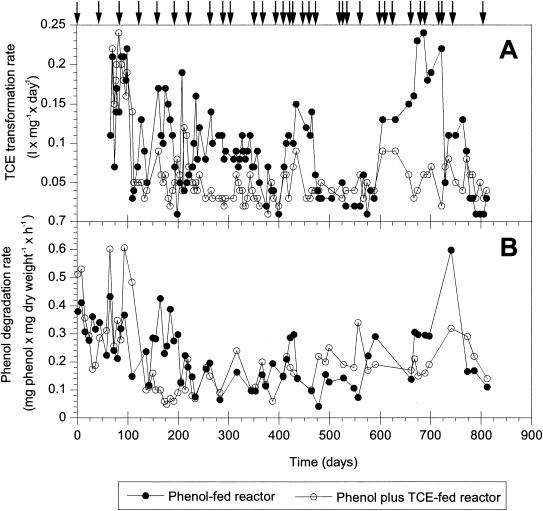
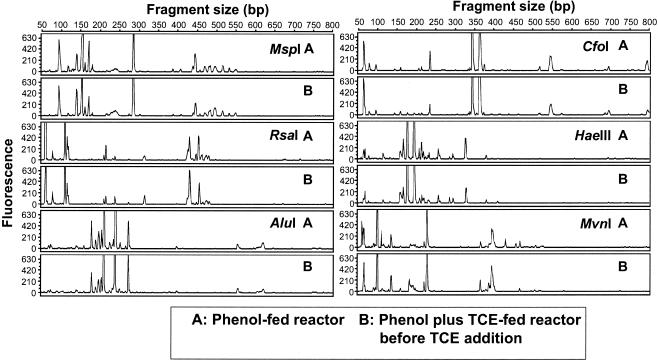
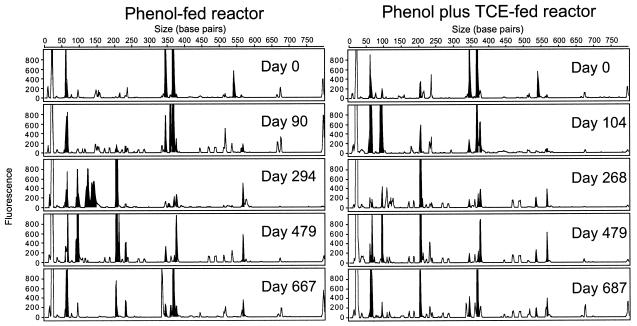
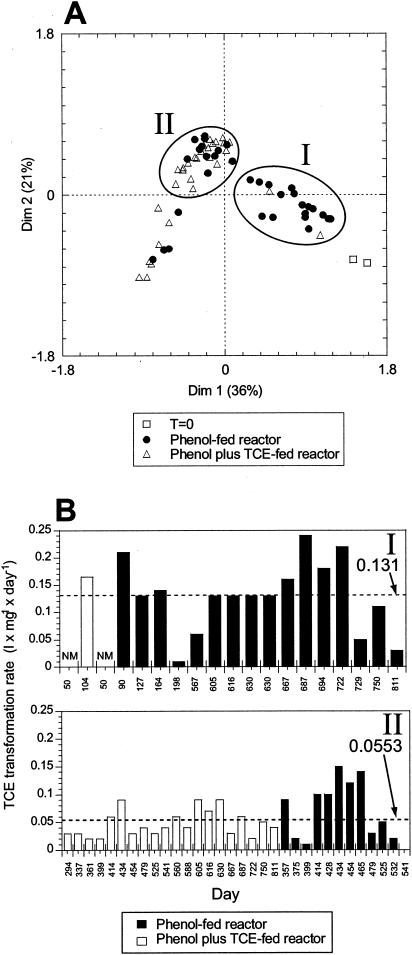
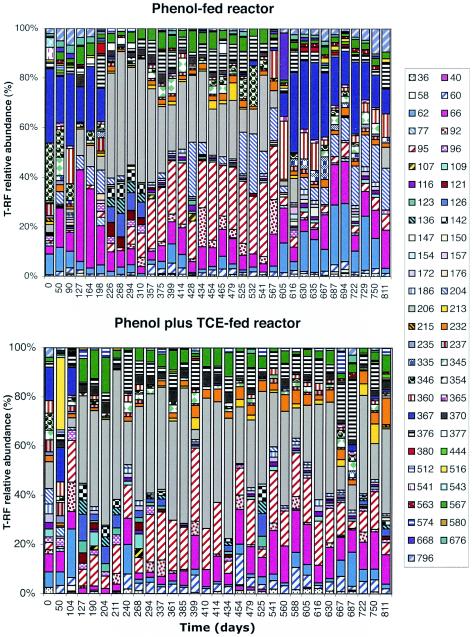
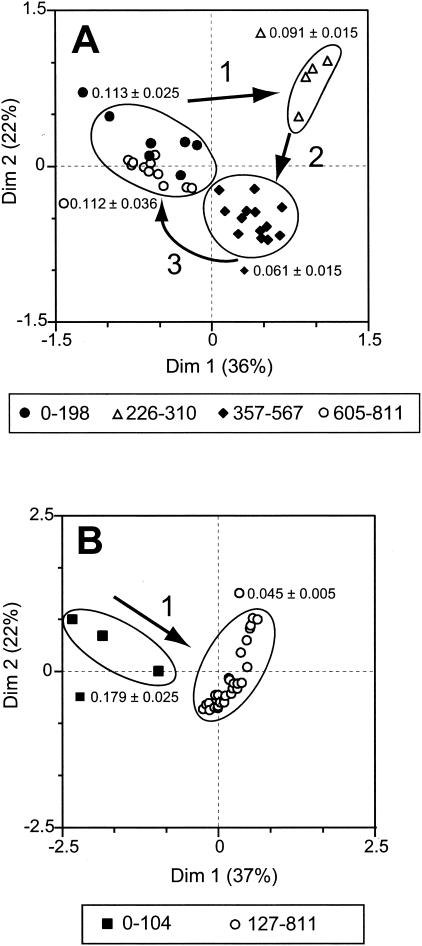
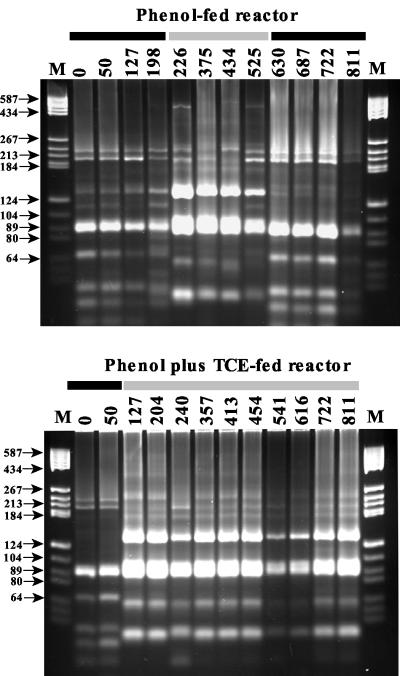
The effects of more than 2 years of trichloroethene (TCE) application on community succession and function were studied in two aerobic sequencing batch reactors. One reactor was fed phenol, and the second reactor was fed both phenol and TCE in sequence twice per day. After initiation of TCE loading in the second reactor, the TCE transformation rates initially decreased, but they stabilized with an average second-order rate coefficient of 0.044 liter mg(-1) day(-1) for 2 years. In contrast, the phenol-fed reactor showed higher and unstable TCE transformation rates, with an average rate coefficient of 0.093 liter mg(-1) day(-1). Community analysis by terminal restriction fragment length polymorphism (T-RFLP) analysis of the 16S rRNA genes showed that the phenol-plus-TCE-fed reactor had marked changes in community structure during the first 100 days and remained relatively stable afterwards, corresponding to the period of stable function. In contrast, the community structure of the phenol-fed reactor changed periodically, and the changes coincided with the periodicity observed in the TCE transformation rates. Correspondence analysis of each reactor community showed that different community structures corresponded with function (TCE degradation rate). Furthermore, the phenol hydroxylase genotypes, as determined by restriction fragment length polymorphism analysis, corresponded to community structure patterns identified by T-RFLP analysis and to periods when the TCE transformation rates were high. Long-term TCE stress appeared to select for a different and stable community structure, with lower but stable TCE degradation rates. In contrast, the community under no stress exhibited a dynamic structure and dynamic function.


Figures

FIG. 1.
FIG. 1.
Long-term functional responses of the phenol-fed and phenol-plus-TCE-fed reactors. (A) TCE transformation rates. (B) Phenol degradation rates. The arrows indicate the sampling days used for the community structure study.
FIG. 2.
FIG. 2.
T-RFLP electropherograms of PCR-amplified 16S rDNA bacterial genes from replicate reactor communities before TCE application to the phenol-plus-TCE-fed reactor. Samples were digested with six different restriction enzymes individually.
FIG. 3.
FIG. 3.
Changes in bacterial community structure over time. T-RFLP electropherograms were generated from a CfoI digest of the 16S rDNA PCR product. The shaded peaks indicate dynamic ribotypes.
FIG. 4.
FIG. 4.
Community structure and function relationships between reactors. (A) CA of T-RFLP data from reactor communities. Results from independent digests with CfoI and HaeIII were combined for the analysis. Circles and roman numbers indicate periods when the community structures of the two reactors were similar, as follows: cluster I, phenol-fed reactor on days 50 to 198, 567, and 605 to 811 and phenol-plus-TCE-fed reactor on days 50 to 104; cluster II, phenol-fed reactor on days 357 to 541 and phenol-plus-TCE-fed reactor on days 294 to 361, 399, and 414 to 811. T=0, day 0 of each reactor before TCE application to one of them. (B) TCE transformation rates for the two clusters identified by CA. Graph I, cluster I; graph II, cluster II. The dotted lines indicate the average TCE transformation rates (in liter per milligram per day) for the days analyzed. Dim, dimension; NM, not measured.
FIG. 5.
FIG. 5.
Relative abundance of bacterial terminal restriction fragments (T-RF) from reactor samples after digestion with CfoI. The numbers next to the symbols on the right indicate the sizes of the T-RFs (in base pairs).
FIG. 6.
FIG. 6.
CA of T-RFLP data for each reactor community individually. (A) Phenol-fed reactor; (B) phenol-plus-TCE-fed reactor. The numbers next to the symbols under each panel indicate the day periods. The arrows and numbers (1 to 3) in the graphs indicate the order of the changes in community structure. Results from independent digestions with CfoI and HaeIII were combined for the analysis. The circled areas indicate the different clusters. The mean ± 95% confidence interval for the TCE transformation rates for each of the different clusters is indicated next to the circle. Dim, dimension.
FIG. 7.
FIG. 7.
Community restriction patterns of PCR-amplified phenol hydroxylase genes digested with RsaI and MspI. The number above each lane indicates the time (in days). The bars at the top indicate the samples with similar fingerprint patterns within and between reactors as determined by unweighted pair group with mathematical average cluster analysis. Lanes M contained markers. The numbers next to the arrows indicate the sizes of the fragments (in base pairs) in the marker lanes.

References

    1. Agency for Toxic Substances and Disease Registry. 1994. National exposure registry. Trichloroethylene (TCE) subregistry baseline technical report (revised). NTIS publication PB95-154589. Agency for Toxic Substances and Disease Registry, U. S. Public Health Service, Department of Health and Human Services, Atlanta, Ga.
    1. Alexander, M. 1994. Biodegradation and bioremediation. Academic Press, San Diego, Calif.
    1. Amann, R. I., W. Ludwig, and K. H. Schleifer. 1995. Phylogenetic identification and in situ detection of individual microbial cells without cultivation. Microbiol. Rev. 59:143-169. - PMC - PubMed
    1. Ampe, F., D. Léonard, and N. Lindley. 1998. Repression of phenol catabolism by organic acids in Ralstonia eutropha. Appl. Environ. Microbiol. 64:1-6. - PMC - PubMed
    1. Anderson, J. E., and P. L. McCarthy. 1997. Transformation yields of chlorinated ethenes by a methanotrophic mixed culture expressing particulate methane monooxygenase. Appl. Environ. Microbiol. 63:687-693. - PMC - PubMed

Publication types

MeSH terms

LinkOut - more resources