. 2004 Aug 4;24(31):6991-7006.
doi: 10.1523/JNEUROSCI.1422-04.2004.

Natural stimulus statistics alter the receptive field structure of v1 neurons

Affiliations

Natural stimulus statistics alter the receptive field structure of v1 neurons

Stephen V David et al. J Neurosci. .

Abstract

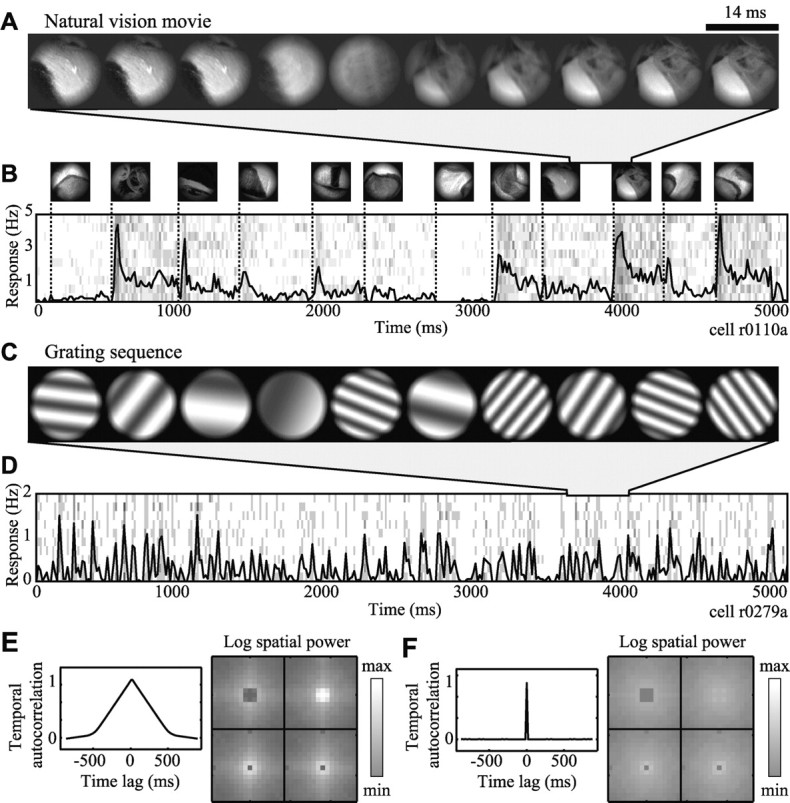
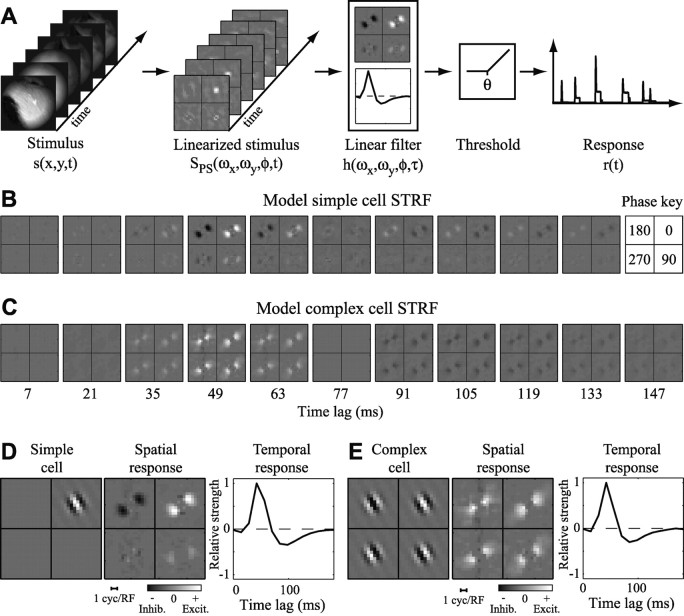
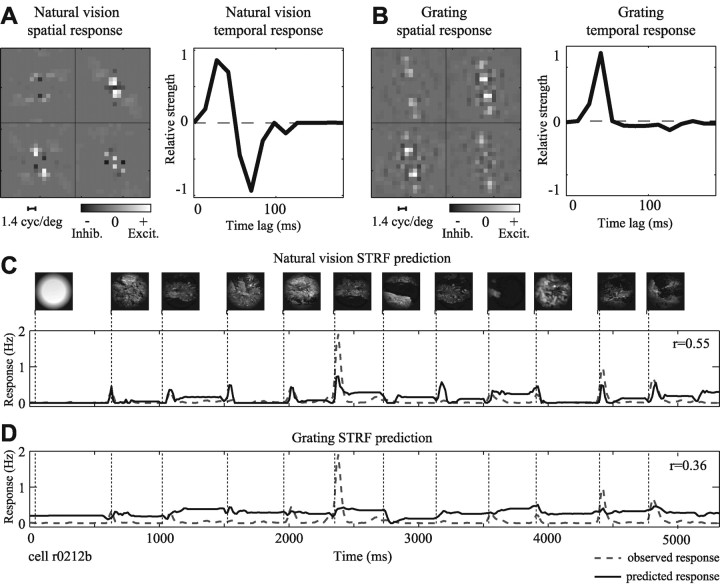
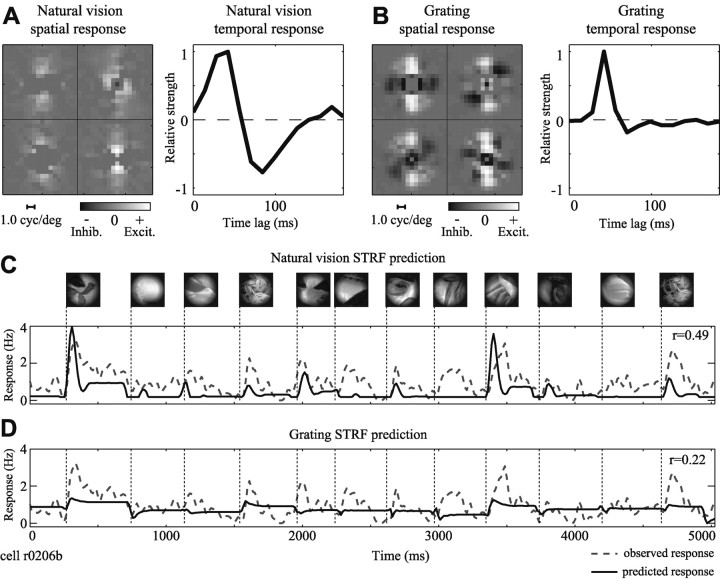
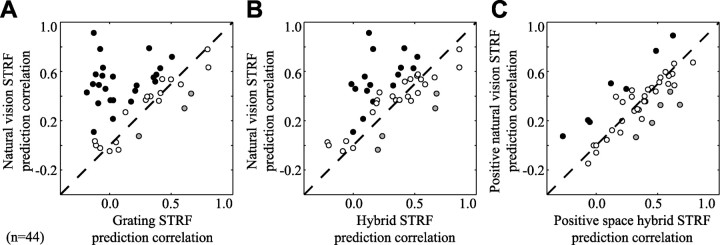
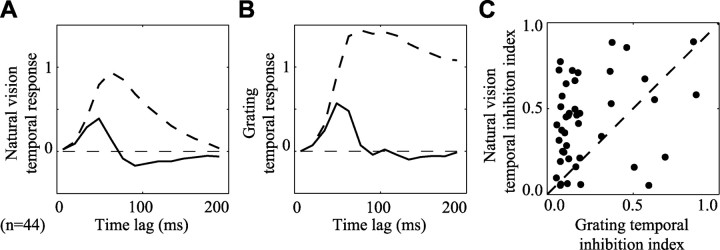
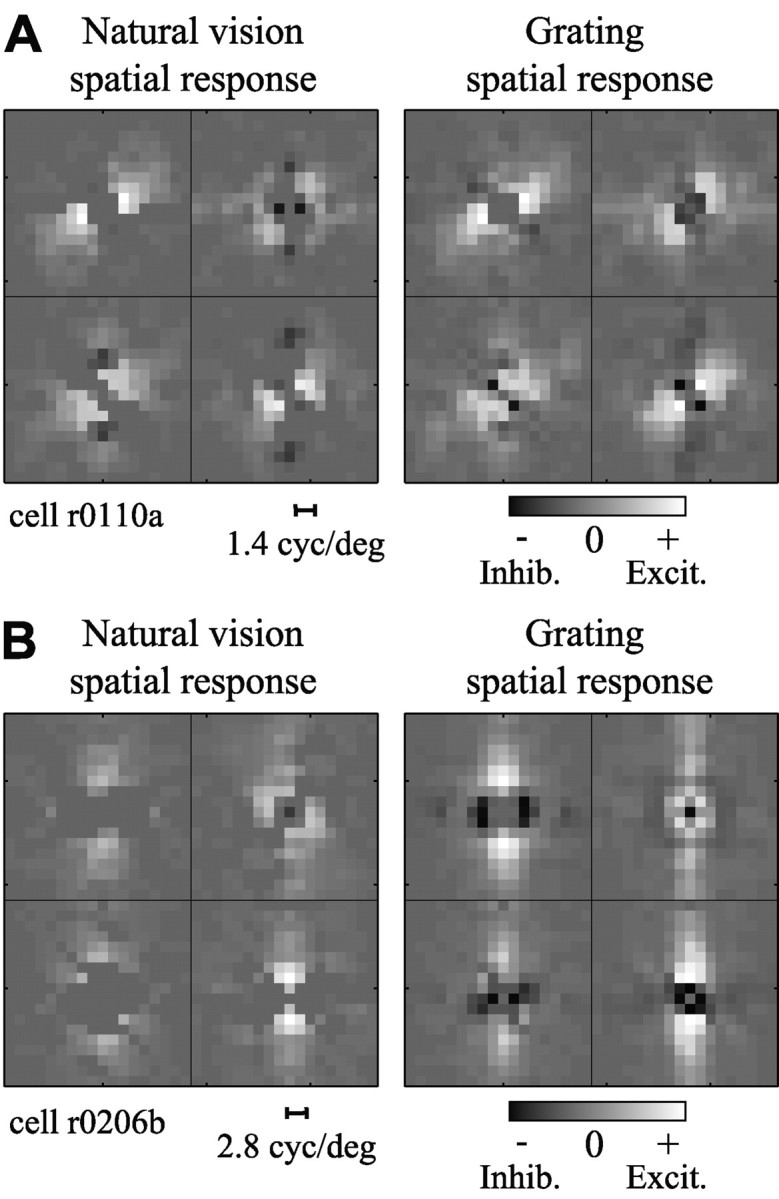
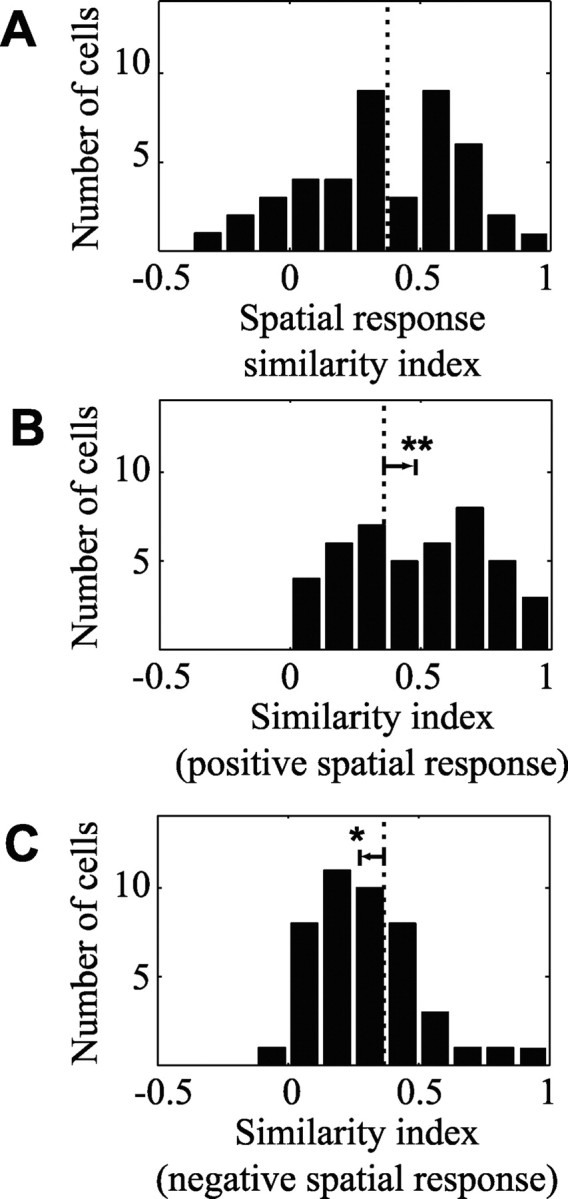
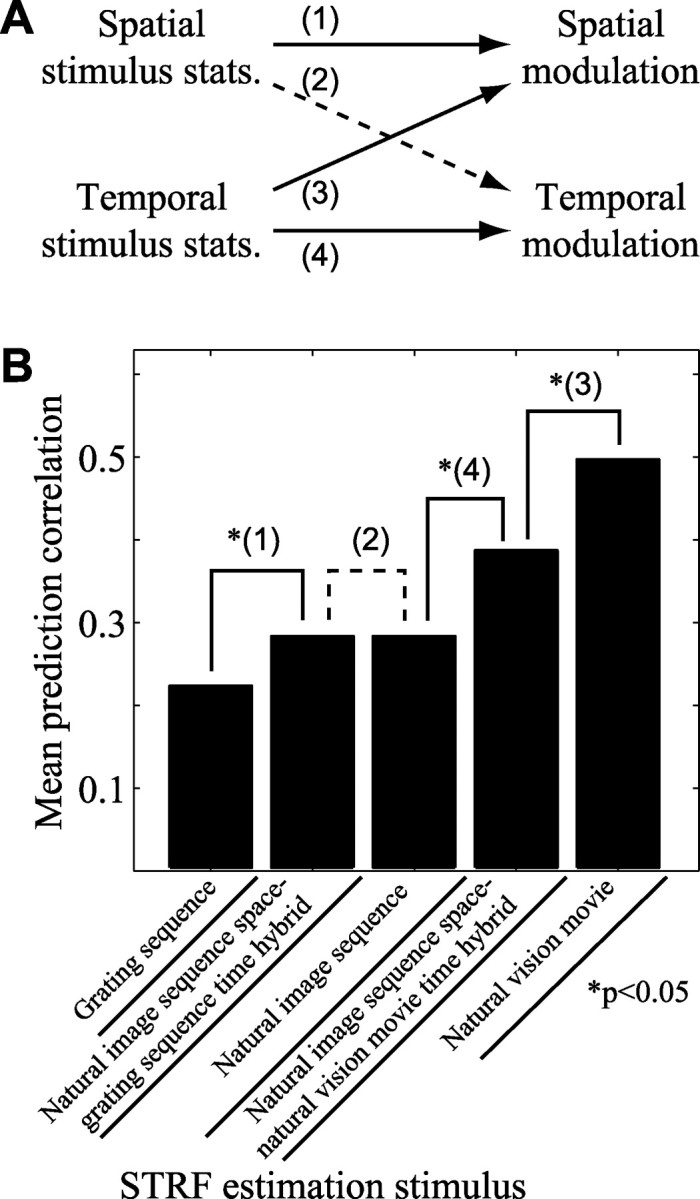
Studies of the primary visual cortex (V1) have produced models that account for neuronal responses to synthetic stimuli such as sinusoidal gratings. Little is known about how these models generalize to activity during natural vision. We recorded neural responses in area V1 of awake macaques to a stimulus with natural spatiotemporal statistics and to a dynamic grating sequence stimulus. We fit nonlinear receptive field models using each of these data sets and compared how well they predicted time-varying responses to a novel natural visual stimulus. On average, the model fit using the natural stimulus predicted natural visual responses more than twice as accurately as the model fit to the synthetic stimulus. The natural vision model produced better predictions in >75% of the neurons studied. This large difference in predictive power suggests that natural spatiotemporal stimulus statistics activate nonlinear response properties in a different manner than the grating stimulus. To characterize this modulation, we compared the temporal and spatial response properties of the model fits. During natural stimulation, temporal responses often showed a stronger late inhibitory component, indicating an effect of nonlinear temporal summation during natural vision. In addition, spatial tuning underwent complex shifts, primarily in the inhibitory, rather than excitatory, elements of the response profile. These differences in late and spatially tuned inhibition accounted fully for the difference in predictive power between the two models. Both the spatial and temporal statistics of the natural stimulus contributed to the modulatory effects.


Figures

Figure 1.
Figure 1.
Natural and synthetic stimuli. A, Natural vision movies mimic the pattern of stimulation in a parafoveal receptive field during free viewing of a static, monochromatic natural scene. The stimulus remains constant during simulated fixations and changes rapidly during simulated saccades (compare frames 2, 3 with 5, 6). B, Five seconds of the same movie are shown schematically in the top row. The pattern appearing during each simulated fixation appears once, aligned on the left edge to the time of fixation onset. Below is the PSTH averaged over 10 repeated movie presentations. After the onset of each new fixation (dotted lines) the neuron responded with a brief burst of activity, followed by a weaker sustained response. C, Several frames from a grating sequence. The sine wave grating shown in each 14 msec frame varies randomly in orientation, spatial frequency, and spatial phase. D, The plot shows the PSTH averaged over 10 repeated presentations of a 5 sec grating sequence. E, Temporal and spatial statistics of a natural vision movie. Temporal autocorrelation (left) decreases linearly to zero at lags of ∼500 msec because of the temporal dynamics of simulated saccades. The log spatial power spectrum (right) is plotted in the phase-separated Fourier domain, where each subpanel refers to a different spatial phase (for details, see Materials and Methods, Fig. 2). Power decreases linearly from low frequencies at the center of each subpanel, reflecting the 1/f2 power spectrum of natural images. F, Temporal and spatial statistics of a grating sequence, plotted in the same manner as E. There is no temporal autocorrelation at nonzero time lags because the grating pattern changes randomly in each frame. Log spatial power is nearly uniform, reflecting the sampling of grating parameters.
Figure 2.
Figure 2.
Linearized STRF model. The phase-separated Fourier model incorporates a nonlinear spatial transformation at its input stage to account for response properties of both simple and complex cells. A, Visual input is the time-varying sequence of gray scale images at the left. The stimulus is Fourier-transformed and projected onto quadrature spatial phase channels according to Equation 2. The transformed stimulus is convolved with a spatiotemporal filter and thresholded according to Equation 1 to produce the instantaneous firing rate, r(t). B, STRF estimated using natural vision movie data for a model simple cell. Brighter regions indicate input channels correlated with an increase in firing (excitation), whereas dark regions indicate channels correlated with a decrease in firing (inhibition). At each time lag, the four subpanels show spatial frequency and orientation tuning at four spatial phases (key at far right). Spatial frequency and orientation are plotted in the Fourier domain. Radial position in the subpanel corresponds to spatial frequency, and angle corresponds to orientation. For this neuron, excitatory responses are confined to the top right subpanel, consistent with the fact that the model simple cell had even, on-center spatial phase tuning. The top left subpanel reveals inhibition at a 180° phase offset, reflecting the linear phase tuning of the simple cell. C, STRF estimated for a model complex cell. Spatial and temporal tuning resemble that in B, except all four phase channels drive excitatory responses. D, Spatial (middle) and temporal (right) response functions for the simple cell STRF in B. At left is the Gabor function showing the actual spatial tuning of the model simple cell. The spatial response function shows excitatory tuning at the phase corresponding to the even, on-center Gabor. E, Spatial and temporal response functions composing the complex cell STRF in C. The model complex cell is excited by spatial patterns matching any of the four Gabor functions at the left. Thus, all four phase channels indicate excitatory tuning at the corresponding orientation and spatial frequency. Inhib., Inhibition; Excit., excitation.
Figure 3.
Figure 3.
Natural stimulus statistics influence temporal response properties. A, STRF estimated using natural vision movie. Axes are as in Figure 2 D. The spatial response function, left, is tuned to stimuli just counterclockwise of horizontal, with peak spatial frequency tuning of 1.1 cycle/°. The temporal response function shows a peak latency of 35 msec followed by a negative, inhibitory component at greater time lags (63-91 msec). B, The STRF estimated using a grating sequence shows some differences in tuning. The spatial response function is similar to that in A, although with slightly higher excitatory spatial frequency tuning (peak, 1.4 cycle/°). However, the temporal response is quite different, with a peak latency of 49 msec and no late inhibitory component. C, STRFs were compared by measuring their ability to predict natural vision movie validation data. The prediction by the natural vision movie STRF (solid line) is overlaid on the observed PSTH (dashed line). This neuron gave a highly transient response during each fixation epoch in the natural vision movie. The predicted PSTH matches these transients well, with a correlation of r = 0.55. D, The grating sequence STRF fails to predict the transient responses and has a significantly lower prediction correlation (r = 0.36; p < 0.05, randomized paired t test). Inhib., Inhibition; Excit., excitation.
Figure 4.
Figure 4.
Natural stimulus statistics influence spatial tuning in some neurons. A, Spatial and temporal response functions estimated using natural vision movie data indicate a preference for horizontal stimuli at 1.0 cycle/°. Peak latency is 49 msec, followed by an inhibitory response (77-91 msec). B, The grating spatial response function also shows excitatory tuning to horizontal stimuli, but spatial frequency tuning is higher (2.4 cycles/°). Inhibitory tuning is also clearly present. The time course is quite brief (peak latency, 49 msec) and lacks a strong negative component. C, The natural vision STRF predicts a substantial portion of the observed PSTH (r = 0.49). D, The grating STRF predicts with significantly lower accuracy (r = 0.22; p < 0.05, randomized paired t test). In addition to missing transient responses, it also fails to predict modulation between fixations as well as the natural vision STRF. Inhib., Inhibition; Excit., excitation.
Figure 5.
Figure 5.
Predictive power depends on estimation stimulus class. A, Comparison of natural vision STRF and grating STRF predictions of natural vision movie validation responses. The position on the x-axis shows the correlation (Pearson's r) between the grating STRF prediction and the observed response. The y-axis shows the prediction correlation for natural vision STRFs. Filled points above the dashed line correspond to neurons with significantly more accurate natural vision STRF predictions, whereas shaded points below the line indicate more accurate grating STRF predictions (p < 0.05, randomized paired t test). Natural vision STRFs predict responses (mean r = 0.42) consistently better than grating STRFs (mean r = 0.19; p < 0.001, randomized paired t test; n = 44). B, Comparison of natural vision movie predictions by hybrid STRFs and natural vision STRFs. Hybrid STRFs are composed of grating spatial response functions and natural vision temporal response functions. Natural vision STRFs predict responses (mean r = 0.42) significantly better than hybrid STRFs (mean r = 0.30; p < 0.001, randomized paired t test). Thus, incorporating natural vision temporal responses into both STRF classes decreases but does not account entirely for the gap in predictions. C, Comparison of natural vision movie predictions by positive space hybrid STRFs and positive space natural vision STRFs. These STRFs have excitatory spatial tuning estimated using grating sequence and natural vision movie data, respectively. However, both incorporate natural vision temporal responses and have negative coefficients removed from their spatial response functions. Positive space natural vision movie STRFs (mean r = 0.34) predict responses no better than positive space hybrid STRFs (mean r = 0.35; not significant, randomized t test). Thus, changes in temporal response and spatially tuned inhibition account for the differences in predictive power of STRFs estimated using the two stimulus classes.
Figure 6.
Figure 6.
Statistics of natural stimuli affect temporal response properties. A, The mean natural vision temporal response function (solid line) shows a strong biphasic pattern: excitation at early latencies, peaking at 49 msec, followed by a negative component. The step response (dashed line), found by integrating the temporal response in time, predicts transient responses to fixation epochs. B, The mean grating temporal response function is primarily monophasic. The time course of the excitatory component is similar to that for natural vision movies, but it lacks the late inhibitory component. The step response predicts a sustained response without a transient. C, Scatterplot compares temporal inhibition indices (Eq. 14) measured using grating sequences (x-axis) with those measured using natural vision movies (y-axis). Larger index values correspond to a stronger negative component in a temporal response function. Most points lie above the line of unity slope, indicating that temporal inhibition index values were larger for natural vision movie responses. The mean inhibition index for natural vision movies (0.37) is significantly higher than for grating sequences (0.18; p < 0.001, randomized paired t test; n = 44).
Figure 7.
Figure 7.
Spatial response functions compared between stimulus classes. A, Natural vision (left) and grating (right) spatial response functions estimated for a single neuron. Both have excitatory tuning to diagonal orientations at 3.0 cycles/°. Inhibitory tuning is localized to a small range of spatial channels. Residual correlation bias has been normalized for this spatial response function pair. B, Other neurons in V1 reveal stimulus-dependent patterns in their spatial response functions. The natural vision and grating spatial response functions for this neuron have similar excitatory tuning, but inhibition is much broader in the grating spatial response. The effect of residual bias normalization can be seen by comparing this grating spatial response function with Figure 4 B. Inhib., Inhibition; Excit., excitation.
Figure 8.
Figure 8.
Natural stimuli affect spatially tuned inhibition. A, Histogram of similarity index values (Eq. 16) between spatial response functions estimated using natural vision movies and grating sequences. The distribution of index values has a mean of 0.37 (dotted line; n = 44). B, Histogram of similarity index values between only the positive coefficients of the same spatial response functions. The distribution is shifted significantly toward higher values relative to A (arrow), with a mean of 0.49 (p < 0.001, randomized paired t test). C, In contrast, the histogram of spatial similarity between the negative coefficients reveals a significantly lower mean of 0.30 (p < 0.05, randomized paired t test), suggesting that the greater difference between spatial response functions lies in inhibitory tuning.
Figure 9.
Figure 9.
Sources of stimulus-dependent modulation. A, Differences in either spatial or temporal stimulus statistics (stats.) could potentially modulate spatial and temporal response properties in V1. The four possible relationships between stimulus statistics and response modulation are indicated by arrows 1-4. Solid arrows indicate observed relationships. B, We assessed these potential relationships by comparing predictions of hybrid STRFs estimated using natural vision movies, grating sequences, and natural image sequences (n = 21 neurons). Labels marking each comparison indicate the relevant relationship in A. Solid lines indicate significant improvements in prediction accuracy (p < 0.05). These comparisons indicate that natural temporal stimulus statistics modulate both spatial and temporal response properties. Natural spatial statistics modulate spatial response properties, but they do not influence temporal response properties (dashed line). For details, see Results.

Similar articles

Cited by

References

    1. Adelson EH, Bergen JR (1985) Spatiotemporal energy models for the perception of motion. J Opt Soc Am 2: 284-299. - PubMed
    1. Aertsen AMHJ, Johannesma PIM (1981) A comparison of the spectro-temporal sensitivity of auditory neurons to tonal and natural stimuli. Biol Cybern 42: 145-156. - PubMed
    1. Albrecht DG, Geisler WS (1991) Motion selectivity and the contrast-response function of simple cells in the visual cortex. Vis Neurosci 7: 531-546. - PubMed
    1. Barlow HB (1961) Possible principles underlying the transformation of sensory messages. In: Sensory communication (Rosenbluth WA, ed), pp 217-234. Cambridge, MA: MIT.
    1. Bauman LA, Bonds AB (1991) Inhibitory refinement of spatial frequency selectivity in single cells of the cat striate cortex. Vision Res 31: 933-944. - PubMed

Publication types