

Putting fear in its place: remapping of hippocampal place cells during fear conditioning
- PMID: 15295037
- PMCID: PMC6729593
- DOI: 10.1523/JNEUROSCI.5492-03.2004
Putting fear in its place: remapping of hippocampal place cells during fear conditioning
Abstract
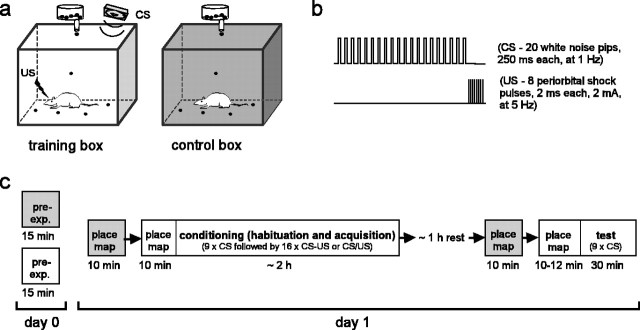
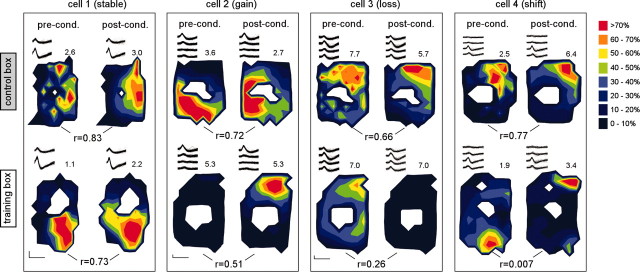
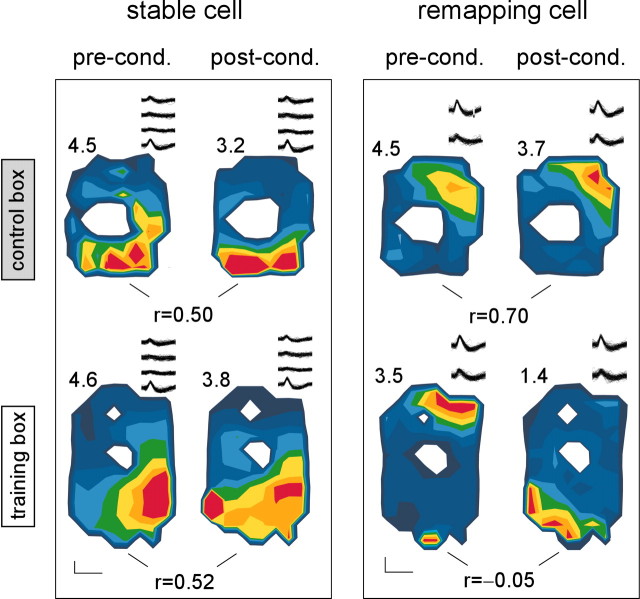
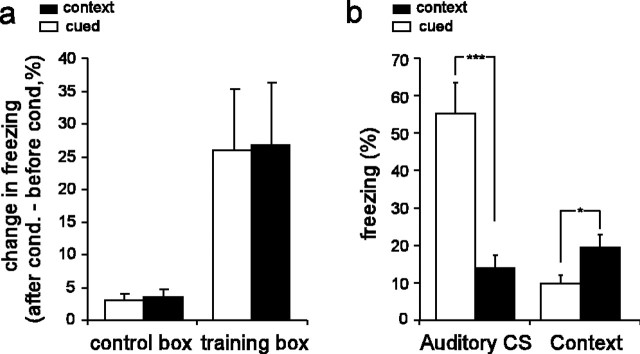
We recorded hippocampal place cells in two spatial environments: a training environment in which rats underwent fear conditioning and a neutral control environment. Fear conditioning caused many place cells to alter (or remap) their preferred firing locations in the training environment, whereas most cells remained stable in the control environment. This finding indicates that aversive reinforcement can induce place cell remapping even when the environment itself remains unchanged. Furthermore, contextual fear conditioning caused significantly more remapping of place cells than auditory fear conditioning, suggesting that place cell remapping was related to the rat's learned fear of the environment. These results suggest that one possible function of place cell remapping may be to generate new spatial representations of a single environment, which could help the animal to discriminate among different motivational contexts within that environment.
Figures

Similar articles
-
Extinction of Learned Fear Induces Hippocampal Place Cell Remapping.J Neurosci. 2015 Jun 17;35(24):9122-36. doi: 10.1523/JNEUROSCI.4477-14.2015. J Neurosci. 2015. PMID: 26085635 Free PMC article.
-
Long-Term Characterization of Hippocampal Remapping during Contextual Fear Acquisition and Extinction.J Neurosci. 2020 Oct 21;40(43):8329-8342. doi: 10.1523/JNEUROSCI.1022-20.2020. Epub 2020 Sep 21. J Neurosci. 2020. PMID: 32958567 Free PMC article.
-
Hippocampal place cells acquire location-specific responses to the conditioned stimulus during auditory fear conditioning.Neuron. 2003 Feb 6;37(3):485-97. doi: 10.1016/s0896-6273(03)00033-3. Neuron. 2003. PMID: 12575955
-
The place of the hippocampus in fear conditioning.Eur J Pharmacol. 2003 Feb 28;463(1-3):217-23. doi: 10.1016/s0014-2999(03)01283-4. Eur J Pharmacol. 2003. PMID: 12600712 Review.
-
Pavlovian fear conditioning as a behavioral assay for hippocampus and amygdala function: cautions and caveats.Eur J Neurosci. 2008 Oct;28(8):1661-6. doi: 10.1111/j.1460-9568.2008.06485.x. Eur J Neurosci. 2008. PMID: 18973583 Review.
Cited by
-
Locus Coeruleus Phasic, But Not Tonic, Activation Initiates Global Remapping in a Familiar Environment.J Neurosci. 2019 Jan 16;39(3):445-455. doi: 10.1523/JNEUROSCI.1956-18.2018. Epub 2018 Nov 26. J Neurosci. 2019. PMID: 30478033 Free PMC article.
-
Investigating Individual Pre-trauma Susceptibility to a PTSD-Like Phenotype in Animals.Front Syst Neurosci. 2020 Jan 14;13:85. doi: 10.3389/fnsys.2019.00085. eCollection 2019. Front Syst Neurosci. 2020. PMID: 31992972 Free PMC article. Review.
-
Dorsal hippocampus represents locations to avoid as well as locations to approach during approach-avoidance conflict.bioRxiv [Preprint]. 2024 Mar 12:2024.03.10.584295. doi: 10.1101/2024.03.10.584295. bioRxiv. 2024. Update in: PLoS Biol. 2025 Jan 14;23(1):e3002954. doi: 10.1371/journal.pbio.3002954. PMID: 38559154 Free PMC article. Updated. Preprint.
-
Partial or Complete Loss of Norepinephrine Differentially Alters Contextual Fear and Catecholamine Release Dynamics in Hippocampal CA1.Biol Psychiatry Glob Open Sci. 2023 Oct 12;4(1):51-60. doi: 10.1016/j.bpsgos.2023.10.001. eCollection 2024 Jan. Biol Psychiatry Glob Open Sci. 2023. PMID: 38058990 Free PMC article.
-
Reward expectation extinction restructures and degrades CA1 spatial maps through loss of a dopaminergic reward proximity signal.Nat Commun. 2022 Nov 4;13(1):6662. doi: 10.1038/s41467-022-34465-5. Nat Commun. 2022. PMID: 36333323 Free PMC article.
References
-
- Anagnostaras SG, Gale GD, Fanselow MS (2001) Hippocampus and contextual fear conditioning: recent controversies and advances. Hippocampus 11: 8-17. - PubMed
-
- Blanchard RJ, Blanchard DC (1969) Crouching as an index of fear. J Comp Physiol Psychol 67: 370-375. - PubMed
-
- Bostock E, Muller RU, Kubie JL (1991) Experience-dependent modifications of hippocampal place cell firing. Hippocampus 1: 193-205. - PubMed
-
- Buzsaki G (1986) Hippocampal sharp waves: their origin and significance. Brain Res 398: 242-252. - PubMed
Publication types
MeSH terms
Grants and funding
LinkOut - more resources
Full Text Sources