. 2004 Aug 6:4:34.
doi: 10.1186/1471-2458-4-34.

Logistics of community smallpox control through contact tracing and ring vaccination: a stochastic network model

Affiliations

Logistics of community smallpox control through contact tracing and ring vaccination: a stochastic network model

Travis C Porco et al. BMC Public Health. .

Abstract

Background: Previous smallpox ring vaccination models based on contact tracing over a network suggest that ring vaccination would be effective, but have not explicitly included response logistics and limited numbers of vaccinators.

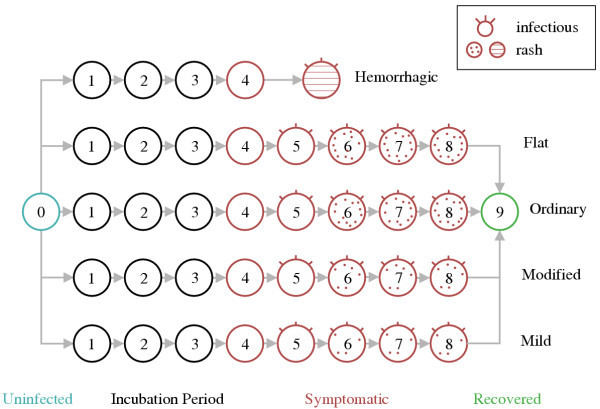
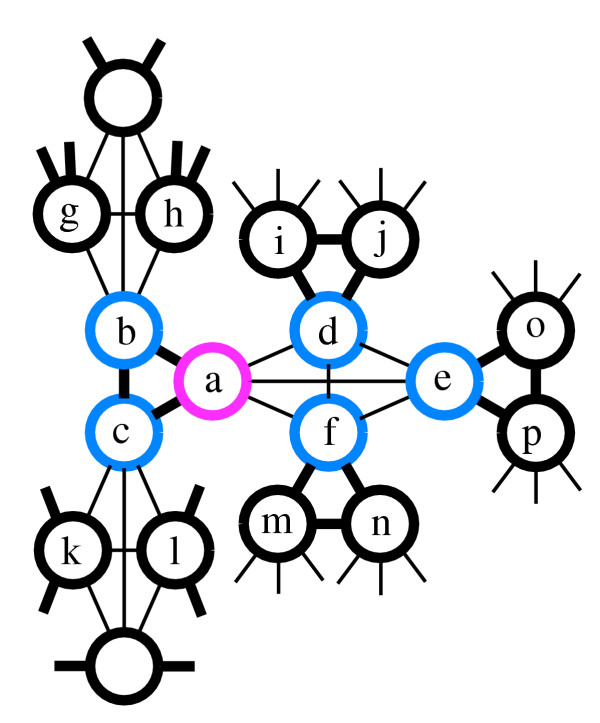
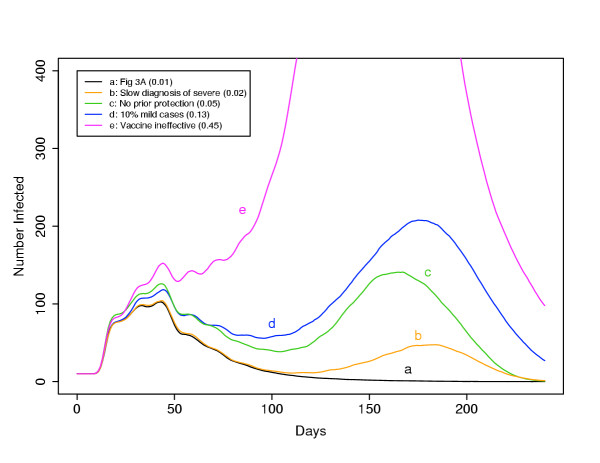
Methods: We developed a continuous-time stochastic simulation of smallpox transmission, including network structure, post-exposure vaccination, vaccination of contacts of contacts, limited response capacity, heterogeneity in symptoms and infectiousness, vaccination prior to the discontinuation of routine vaccination, more rapid diagnosis due to public awareness, surveillance of asymptomatic contacts, and isolation of cases.

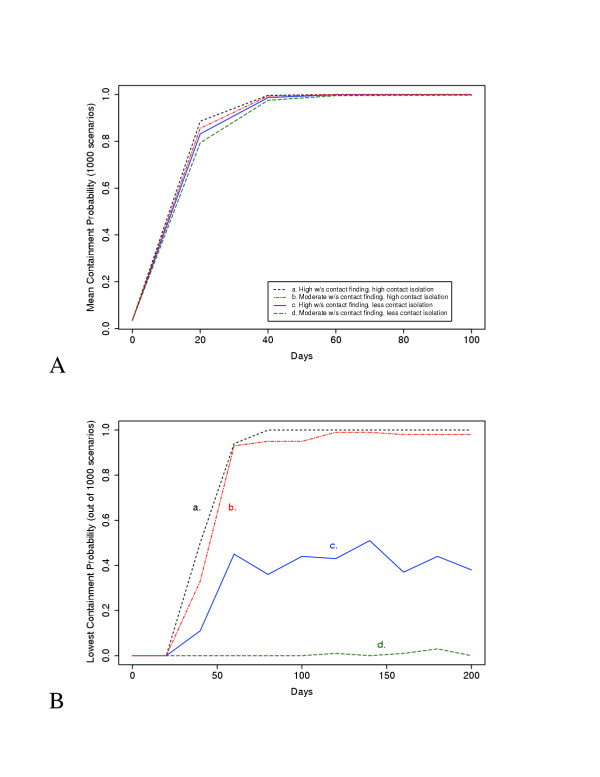
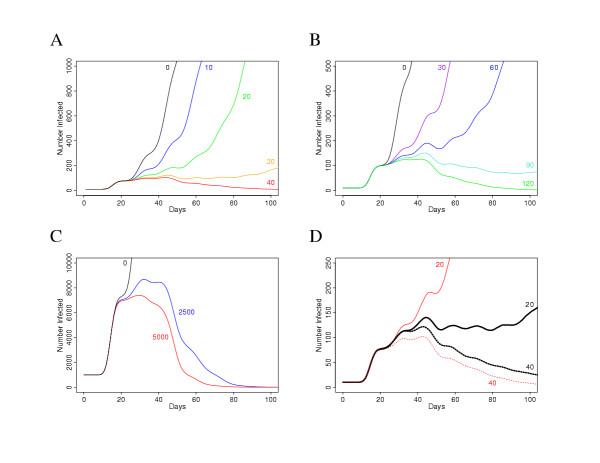
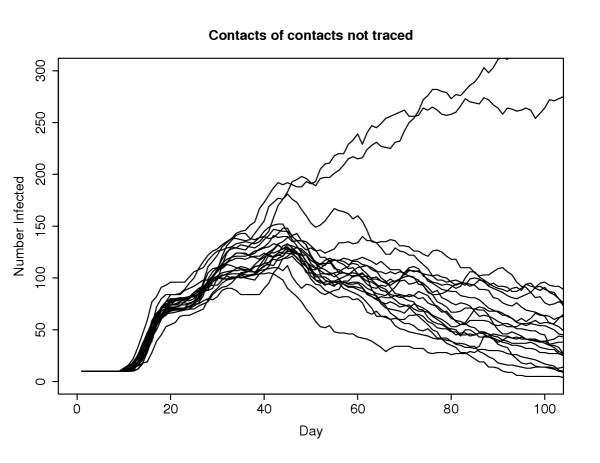
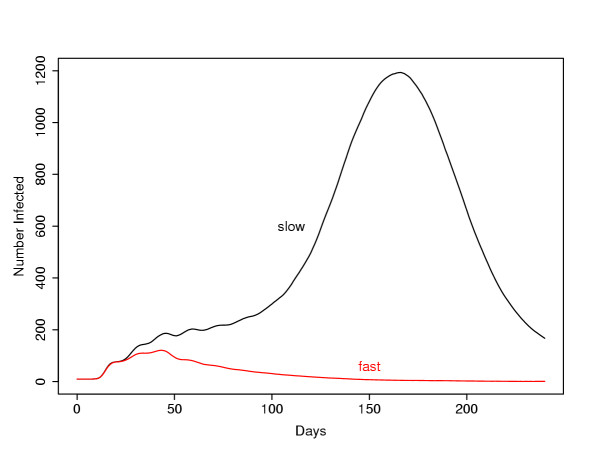
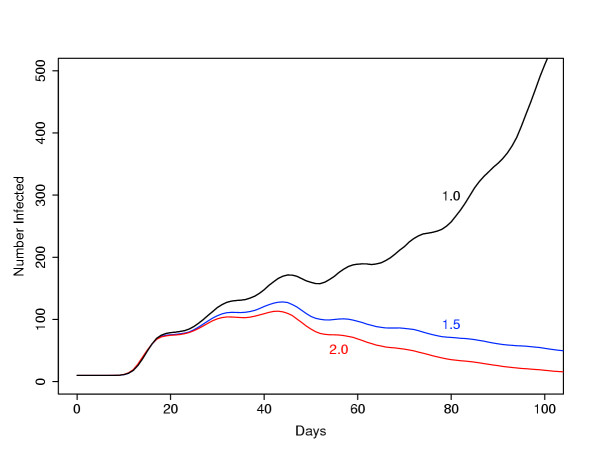
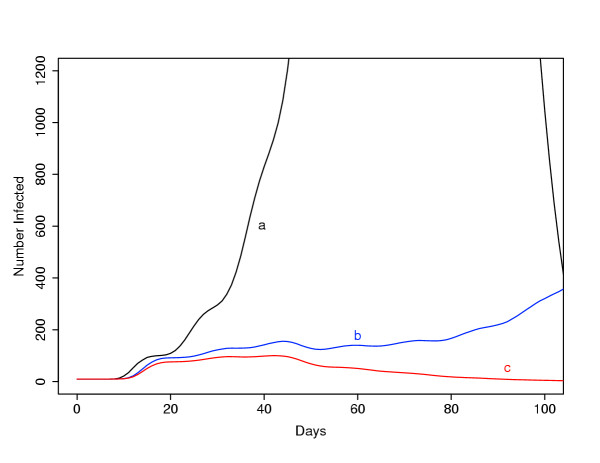
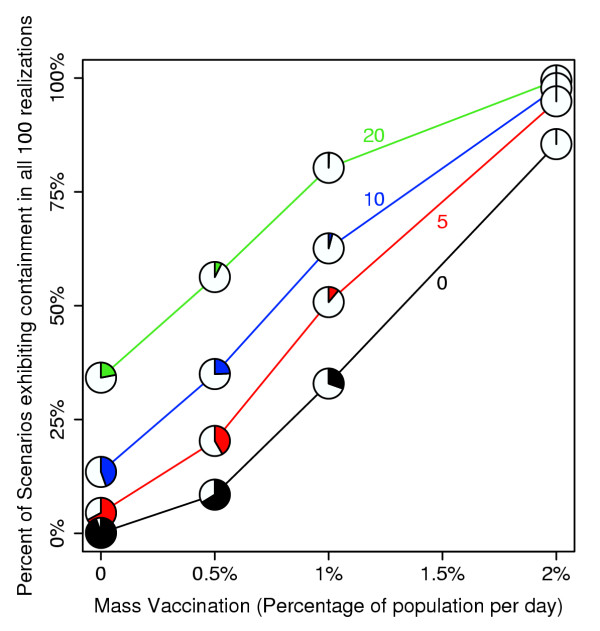
Results: We found that even in cases of very rapidly spreading smallpox, ring vaccination (when coupled with surveillance) is sufficient in most cases to eliminate smallpox quickly, assuming that 95% of household contacts are traced, 80% of workplace or social contacts are traced, and no casual contacts are traced, and that in most cases the ability to trace 1-5 individuals per day per index case is sufficient. If smallpox is assumed to be transmitted very quickly to contacts, it may at times escape containment by ring vaccination, but could be controlled in these circumstances by mass vaccination.

Conclusions: Small introductions of smallpox are likely to be easily contained by ring vaccination, provided contact tracing is feasible. Uncertainties in the nature of bioterrorist smallpox (infectiousness, vaccine efficacy) support continued planning for ring vaccination as well as mass vaccination. If initiated, ring vaccination should be conducted without delays in vaccination, should include contacts of contacts (whenever there is sufficient capacity) and should be accompanied by increased public awareness and surveillance.


Figures

Figure 1
Figure 1
Smallpox stages used in the simulation model. Flat and ordinary smallpox rashes are indicated with more dots than modified and "mild" smallpox, suggesting potentially greater infectiousness. Hemorrhagic smallpox is indicated by horizontal line shading. Further details are provided in Table 6.
Figure 5
Figure 5
5A - The mean containment probability increases as the number of ring vaccinations per day is increased. For this figure, the 1000 "calibrated" parameter sets were chosen, and for each parameter set, 100 realizations were simulated and the fraction of these for which the epidemic was contained to fewer than 500 cases was determined. The average of these 1000 containment fractions is plotted on the vertical axis. We assumed a household contact finding probability of 95% and that the diagnosis rates double after community awareness of the epidemic. We considered high levels of workplace/social (w/s) contact finding (0.9), as well as moderate levels (0.8). We also considered two levels of diagnosis of smallpox among investigated (alerted) contacts: high levels (corresponding to a 3 hour mean delay, indicated by "high contact isolation"), and moderate levels (corresponding to a one day delay, and indicated by "less contact isolation"). The figure shows four such conditions, a. high workplace/social contact finding probability and high contact isolation, b. moderate workplace/social contact finding probability and high contact isolation, c. high workplace/social contact finding probability and less contact isolation, and d. moderate workplace/social contact finding probability and less contact isolation. All other parameter values were chosen from the uncertainty analysis (the 1000 "calibrated" parameter sets). In this figure, "contact isolation" refers to the monitored diagnosis rate, i.e. the rate at which previously asymptomatic contacts who subsequently develop disease will be diagnosed (φ, Table 1, Table 8). 5B - The minimum containment probability out of the same 1000 scenarios chosen in Figure 5A. Whereas in Figure 5A, we averaged the simulated containment frequency (out of 100 realizations for each scenario), in this figure we determined which of the 1000 scenarios led to the lowest containment frequency, and we plotted this single worst (out of 1000) containment frequency, at different levels of ring vaccination capacity, for the same four conditions as in Figure 5A: a. high workplace/social contact finding probability (0.9) and high contact isolation (effective 3 hour delay following symptoms), b. moderate workplace/social contact finding probability (0.8) and high contact isolation, c. high workplace/social contact finding probability (0.9) and less contact isolation (effective one day delay), and d. moderate workplace/social contact finding probability (0.8) and less contact isolation. All parameters are the same as in Figure 5A (the household contact finding probability is 0.95 for all scenarios, and the diagnosis rates are doubled after the onset of community awareness). In this figure, "contact isolation" refers to the monitored diagnosis rate, i.e. the rate at which previously asymptomatic contacts who subsequently develop disease will be diagnosed (φ, Table 1, Table 8).
Figure 2
Figure 2
Network structure shown for households (joined by thick lines) of size 3 and workplace/social groups of size 4 (joined by thin lines); a small portion of the network is shown. Individual a has two household contacts (b and c), and three workplace/social contacts (d, e, and f). If individual a were a smallpox case, the household contacts would be at highest risk for acquiring smallpox, followed by workplace/social contacts; all individuals in the population are at a low risk of casual transmission from individual a. Case investigation of individual a would identify the direct contacts b-f with probabilities that depend on whether the contact is household or workplace/social; if such individuals are identified, they will be vaccinated. If contacts of contacts are being traced, the investigation will subsequently identify individuals g-p.
Figure 3
Figure 3
3A - Expanding severe smallpox epidemic beginning with 10 initial cases, assuming 0, 10, 20, 30, and 40 possible ring vaccinations per day. The household size is 4 and the workplace/social group size is 8; we assume 95% of household contacts are traceable (with a mean delay of 1 day) and 80% of workplace/social contacts are traceable (with a mean delay of 2 days). We also assume that 25% of the population have 50% protection from infection resulting from vaccination prior to the discontinuation of routine vaccination. We assume that infection will be transmitted to close contacts with a mean time of 0.2 days, and that each person while infective causes on average 0.15 casual (untraceable) infections per day. We assume that individuals are 20% as infectious in the day just before the appearance of the rash as they will be during the first week of the rash, and that individuals are 20% as infectious as this (4% as infectious as during the first week of the rash) during the prodromal period. We assume that diagnosis rates will increase by a factor of 50% after smallpox becomes known to the community; we assume that each individual contacted during an investigation has a additional diagnosis or removal rate of 0.75 per day following the onset of symptoms (reflecting enhanced surveillance or contact isolation). Important parameters are summarized in Table 1; the full set of parameter choices is outlined in Tables 8-11 in Appendix 2 [see additional file 2]. Diagnosis times are discussed in Appendix 2 [see additional file 2]. 3B - An expanding severe smallpox epidemic under inadequate ring vaccination is shown for parameters identical to Figure 3A, except that workplace/social group sizes are 12 (instead of 8), and the probability of tracing workplace/social contacts is 0.6 (instead of 0.8). 3C - A severe smallpox epidemic is controlled by ring vaccination despite the large number of initial cases. The parameters are identical to Figure 3A, except that 1000 index cases inaugurate the attack in these scenarios (and ring vaccination capacity is much greater, as indicated). While not recommended, ring vaccination may ultimately halt epidemics beginning with many index cases if sufficient vaccination capacity were available, contact finding feasible, and follow-up sufficient. 3D - Tracing contacts of contacts (red) is beneficial when sufficient contact tracing/ring vaccination capacity exists (dotted lines). In these scenarios, all parameters are the same as in Figure 3A; the number of contact tracings possible per day is either 20 or 40 per day. Contacts of contacts are traced in two scenarios; in the other two, only direct contacts of cases are traced. For low levels of ring vaccination (20 per day), tracing contacts of contacts is harmful; for high levels (40 per day) of ring vaccination, it is beneficial to trace contacts of contacts. When the contact tracing/ring vaccination capacity is too small to adequately cover contacts of the cases themselves, diversion of resources to contacts of contacts is harmful; however, provided that sufficient capacity exists, tracing contacts of contacts helps outrun the chain of transmission. Each line corresponds to the average of 100 realizations.
Figure 4
Figure 4
Stochastic variability is illustrated by plotting the number of infectives over time over multiple replications. In this example, most simulations exhibit rapid containment of smallpox. The mean number of cases (averaging over simulations) is influenced by a small number of simulations exhibiting an uncontained epidemic. The parameters are the same as in Figure 3A, except that contacts of contacts are not traced in these replications.
Figure 6
Figure 6
Faster contact tracing may improve the efficacy of ring vaccination. We assume the same baseline parameters as in Figure 3A (e.g. households of size 4, workplace/social groups of size 8, 95% of household contacts traceable, 80% of workplace/social contacts traceable), and 30 ring vaccinations available per day (with contacts of contacts not traced). The fast scenario corresponds to an average one day delay for household and two days for workplace/social contacts (as in Figure 3A); the slow scenario corresponds to an average five day delay for household and ten day delay for workplace/social contacts. This figure shows the average of one hundred realizations starting with ten index cases.
Figure 7
Figure 7
More rapid diagnosis due to public awareness or increased surveillance may lead to far more effective epidemic control. We assume the same baseline parameters as in Figure 3A, and averaged 100 realizations of the epidemic beginning with 10 index cases and assumed a ring vaccination capacity of 20 per day (and contacts of contacts not traced). For the black line, the diagnosis rate of cases does not change after the first case is identified (the multiplier is 1.0); for the blue line, the diagnosis rate increases by 50% (multiplier 1.5) after the first case is identified (as in Figure 3A), resulting in substantially fewer cases; and for the red line, the diagnosis rate is doubled (multiplier 2.0) after the first case is identified, resulting in still fewer cases.
Figure 8
Figure 8
Transmission prior to the rash makes epidemic control more difficult. The figure shows a expanding smallpox epidemic assuming differing levels of infectivity prior to the rash. We assume all parameters are the same as in Figure 3A (and that the ring vaccination capacity is 40 per day). Infectivity prior to the rash is modeled as the relative infectivity during the short (1 day) period of oropharyngeal lesions just prior to the rash (compared to the infectivity during the first week of the rash), and as the relative infectivity during the prodromal period (relative to the period just prior to the rash). For scenario a, relative infectivity during the prodromal period and just prior to the rash is the same as during the first week of the rash, for scenario b, the relative infectivity just prior to the rash is the same as during the first week of the rash, but during the prodromal period is 4% (as in Figure 3A) of this value, and for scenario c, the relative infectivity just prior to the rash is 20% of the infectivity during the first week of the rash, and during the prodromal period is 20% of this value (these two parameters are the same as in Figure 3A).
Figure 9
Figure 9
Additional scenarios, assuming 40 ring vaccinations or contact tracings possible per day, and that contacts of contacts are traced; all parameters are identical to those in Figure 3A unless otherwise indicated. The figure shows the average of 100 replications of five scenarios (Case a repeats the result from Figure 3A for reference); the numbers in parentheses in the legend are the corresponding fraction of the 100 scenarios for which decontainment occurred. For case b, we assumed that flat and hemorrhagic smallpox cases took four times as long on average to diagnose as ordinary cases; for case c., we assumed that no one in the population had prior protection (as opposed to 25% for Figure 3A); for case d, we assumed that an additional 10% of individuals (13% instead of 3%) would develop mild smallpox (with 75% developing ordinary smallpox instead of 85% as in Figure 3A); and for case e, we assumed that the vaccine is completely ineffective and provides no protection against infection.
Figure 10
Figure 10
Mass and ring vaccination together. Low-level mass vaccination programs are improved substantially by the addition of ring vaccination. The shaded pie segments represent the fraction of 1000 scenarios for which containment (as defined in the text) was never realized; the vertical position of the pie chart represents the fraction of the 1000 "calibrated" scenarios for which containment was always achieved. As the fraction of the population mass vaccinated increases or the ring vaccination capacity increases, the probability of containment increases.

References

    1. Alibek K. Biohazard. New York: Random House; 1999.
    1. Koopman J. Controlling smallpox. Science. 2002;298:1342–1344. doi: 10.1126/science.1079370. - DOI - PubMed
    1. Henderson DA. The looming threat of bioterrorism. Science. 1999;283:1279–1282. doi: 10.1126/science.283.5406.1279. - DOI - PubMed
    1. O'Toole T. Smallpox: an attack scenario. Emerging Infectious Diseases. 1999;5:540–546. - PMC - PubMed
    1. Foege WH, Millar JD, Lane JM. Selective epidemiologic control in smallpox eradication. American Journal of Epidemiology. 1971;94:311–315. - PubMed

Publication types

Substances