Comparative Study
. 2004 Aug;87(2):943-57.
doi: 10.1529/biophysj.104/043414.

Salting out the ionic selectivity of a wide channel: the asymmetry of OmpF

Affiliations
Comparative Study

Salting out the ionic selectivity of a wide channel: the asymmetry of OmpF

Antonio Alcaraz et al. Biophys J. 2004 Aug.

Abstract

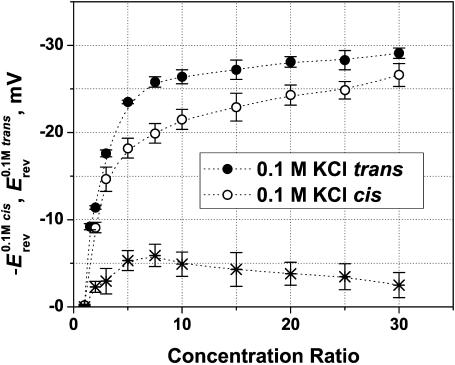
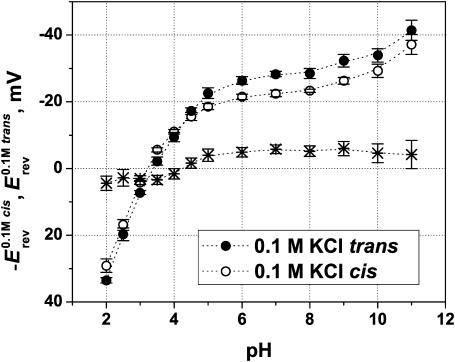
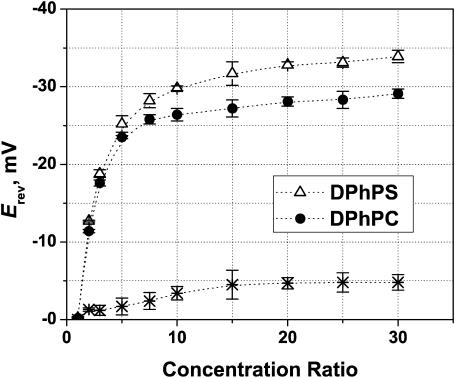
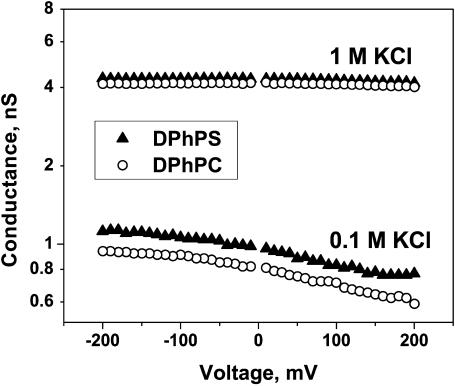
Although the crystallographic structure of the bacterial porin OmpF has been known for a decade, the physical mechanisms of its ionic selectivity are still under investigation. We address this issue in a series of experiments with varied pH, salt concentrations, inverted salt gradient, and charged and uncharged lipids. Measuring reversal potential, we show that OmpF selectivity (traditionally regarded as slightly cationic) depends strongly on pH and salt concentration and is conditionally asymmetric, that is, the calculated selectivity is sensitive to the direction of salt concentration gradient. At neutral pH and subdecimolar salt concentrations the channel exhibits nearly ideal cation selectivity (t(G)(+)=0.98+/-0.01). Substituting neutral DPhPC with DPhPS, we demonstrate that the fixed charge of the host lipid has a small but measurable effect on the channel reversal potential. The available structural information allows for a qualitative explanation of our experimental findings. These findings now lead us to re-examine the ionization state of 102 titratable sites of the OmpF channel. Using standard methods of continuum electrostatics tailored to our particular purpose, we find the charge distribution in the channel as a function of solution acidity and relate the pH-dependent asymmetry in channel selectivity to the pH-dependent asymmetry in charge distribution. In an attempt to find a simple phenomenological description of our results, we also discuss different macroscopic models of electrodiffusion through large channels.


Figures

FIGURE 1
FIGURE 1
A typical recording of transmembrane ion current that illustrates reversal potential measurements. First, spontaneous insertion of a single OmpF channel at zero transmembrane voltage was achieved (arrow). Because of the channel cationic selectivity, the insertion is seen as a non-zero current that flows from the more concentrated 1.5 M KCl solution at the cis side of the membrane to the less concentrated 0.1 M KCl on the trans side. Second, ±50 mV potential was applied to make certain that the number of OmpF channels was equal to 1. Reasonable conductance values determined from the difference in current readings at positive and negative potentials as well as the rare flickering to two-thirds of the total channel conductance at +50 mV provided the evidence for single channel insertion. Finally, ion current was manually set to zero by adjusting the transmembrane potential to −27.7 mV. This potential was read as a “reversal potential.” Time resolution was 1 ms. The DPhPC membrane was bathed by solutions buffered by 5 mM MES at pH 6.
FIGURE 2
FIGURE 2
Thermodynamic cycle used in calculation of pKa shifts for the dissociation equilibrium of a model residue (A) in solution (subscript s) and in the protein environment (subscript p).
FIGURE 3
FIGURE 3
Reversal potential as a function of cis/trans concentration ratio for KCl (solid circles) and NaCl (open diamonds) at pH 6. Bathing solution concentration on the trans side was fixed at 0.1 M, whereas the concentration on the cis side was increased from 0.1 M to 3 M. Membranes were formed from DPhPC. The channel is more permeable to K+ ions along the whole range of studied salt gradients. The asterisks represent the difference between the absolute values of Erev in KCl and NaCl solutions.
FIGURE 4
FIGURE 4
Reversal potential measured at three constant cis/trans KCl concentration ratios (circles, 10; squares, 3; pentagons, 1.5) but different absolute concentrations. Membranes were formed from DPhPC at pH 6. The channel exhibits cationic selectivity: higher salt concentration at the cis side generates negative reversal potential. The absolute value of this potential decreases as salt concentration goes up. (Inset) Cationic transport numbers calculated according to Eq. A5 (Appendix) with salt concentrations corrected with activity coefficients. Solid lines through the data are drawn to guide the eye. It is seen that at Ccis = 3 M cationic selectivity of the channel drops to t+ ≈ 0.6 ÷ 0.7.
FIGURE 5
FIGURE 5
OmpF reversal potential as a function of the concentration ratio for two series of measurements with oppositely directed gradients. (Solid circles) Erev obtained in the series where Ccis > Ctrans = 0.1 M KCl. (Open circles) Plotted as −Erev for the reversed gradient Ctrans > Ccis = 0.1 M KCl. The channel is asymmetric: the absolute value of the reversal potential is greater when the more concentrated solution is on the cis side of the membrane. The asterisks represent the difference. Membranes were formed from the DPhPC at pH 6.
FIGURE 6
FIGURE 6
Dependence of the reversal potential on solution pH at Ccis = 1 M KCl and Ctrans = 0.1 M KCl (solid circles) and at the inverted gradient of the same concentrations (open circles). To facilitate comparison, the data for the inverted gradient are plotted as −Erev. Note that the difference in the reversal potentials (asterisks) changes its sign from high pH to low pH. Thus, Δ|Erev| ∼5 mV at the wide pH range from 5 to 11 and Δ|Erev| ∼ (−4 mV) at pH 2. Membranes were formed from DPhPC.
FIGURE 7
FIGURE 7
Reversal potential is sensitive to the lipid charge. It is larger (by the absolute value) for the negatively charged DPhPS membranes (open triangles) than for the neutral DPhPC membranes (solid circles) in the whole range of concentration gradients at pH 6. Salt concentration on the trans side was kept constant at 0.1 M KCl; the cis side concentration increased from 0.1 M KCl to 3 M KCl. The asterisks represent the difference between Erev in DPhPC and DPhPS.
FIGURE 8
FIGURE 8
A single open OmpF channel has larger conductance when reconstituted into a negatively charged bilayer at pH 6. At 0.1 M KCl concentration and −100 mV applied voltage the channel conductance in the DPhPS membranes exceeds that in the DPhPC membranes by ∼15%. In 1 M KCl solutions this difference is smaller. In this particular experiment it was ∼4%, which was close to the reproducibility of channel conductance from experiment to experiment (SD was ∼3%). Symmetrical salt solutions were used in these measurements.
FIGURE 9
FIGURE 9
(Dashed line, left axis) The electrostatic potential felt by a cation crossing an OmpF monomer along the geometric center of the pore lumen. (Solid line, right axis) The modulus of the transverse electric field along the same coordinate in units of force acting on a cation. The shaded part shows the constriction zone of the pore.
FIGURE 10
FIGURE 10
Charge of the residues that are close to the lumen of OmpF. Residues are divided in three groups corresponding to the constriction (solid line); the part of the channel closer to the periplasmic side (dotted line); and the part closer to the extracellular side (dashed line).
FIGURE 11
FIGURE 11
Correlation between the total charge of the monomer (solid line, right axis) and the measured reversal potential (points, left axis).
FIGURE 12
FIGURE 12
Correlation between asymmetries in the total charge (solid line, left axis) and the reversal potential (points, right axis).
FIGURE 13
FIGURE 13
Solid lines represent the best fit of the model (Eq. 1) to the measured reversal potential (points) (see Fig. 4 for panel A and Fig. 5 for panel B). Dashed lines in panel A show predictions of the GHK model (Eq. A3) with corrections for the changing salt activity fitted to the 3 M points.

References

    1. Aguilella, V. M., and S. M. Bezrukov. 2001. Alamethicin channel conductance modified by lipid charge. Eur. Biophys. J. 30:233–241. - PubMed
    1. Alcaraz, A., E. M. Nestorovich, V. M. Aguilella, and S. M. Bezrukov. 2003. Salting out large pore ion selectivity: studies with OmpF. Biophys. J. 84:533a. - PubMed
    1. Antosiewicz, J., J. A. McCammon, and M. K. Gilson. 1994. Prediction of pH-dependent properties of proteins. J. Mol. Biol. 238:415–436. - PubMed
    1. Antosiewicz, J., J. A. McCammon, and M. K. Gilson. 1996. The determinants of pKas in proteins. Biochemistry. 35:7819–7833. - PubMed
    1. Apell, H. J., E. Bamberg, and P. Lauger. 1979. Effects of surface charge on the conductance of the gramicidin channel. Biochim. Biophys. Acta. 552:369–378. - PubMed

Publication types

LinkOut - more resources