Comparative Study
. 2004 Aug;87(2):988-98.
doi: 10.1529/biophysj.104.039875.

A kinetic study of the growth of fatty acid vesicles

Affiliations
Comparative Study

A kinetic study of the growth of fatty acid vesicles

Irene A Chen et al. Biophys J. 2004 Aug.

Abstract

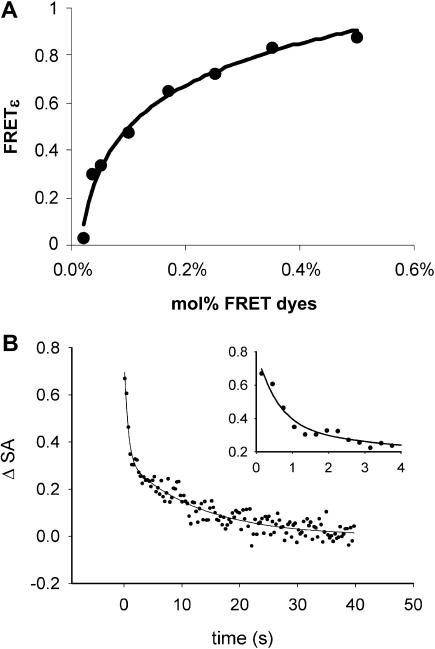
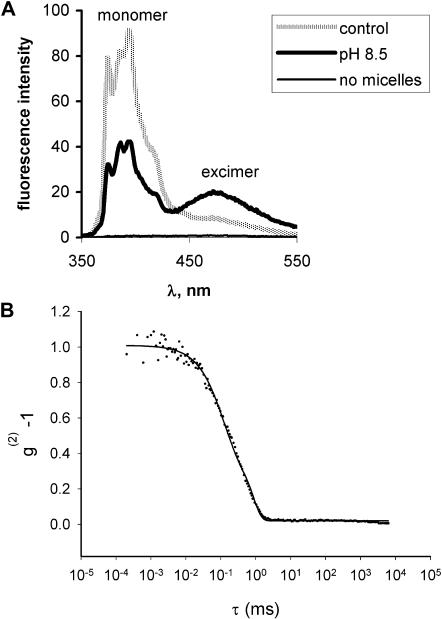
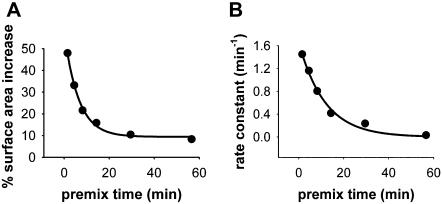
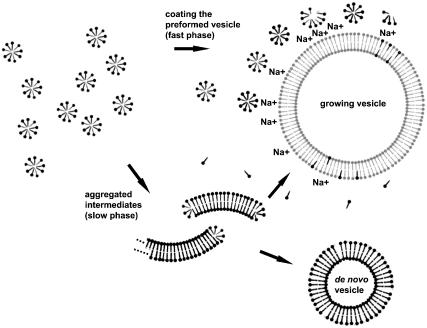
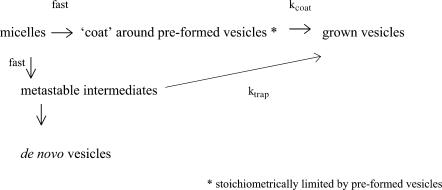
Membrane vesicles composed of fatty acids can be made to grow and divide under laboratory conditions, and thus provide a model system relevant to the emergence of cellular life. Fatty acid vesicles grow spontaneously when alkaline micelles are added to buffered vesicles. To investigate the mechanism of this process, we used stopped-flow kinetics to analyze the dilution of non-exchanging FRET probes incorporated into preformed vesicles during growth. Oleate vesicle growth occurs in two phases (fast and slow), indicating two pathways for the incorporation of fatty acid into preformed vesicles. We propose that the fast phase, which is stoichiometrically limited by the preformed vesicles, results from the formation of a "shell" of fatty acid around a vesicle, followed by rapid transfer of this fatty acid into the preformed vesicle. The slower phase may result from incorporation of fatty acid which had been trapped in an intermediate state. We provide independent evidence for the rapid transformation of micelles into an aggregated intermediate form after transfer from high to low pH. Our results show that the most efficient incorporation of added oleate into oleic acid/oleate vesicles occurs under conditions that avoid a large transient increase in the micelle/vesicle ratio.


Figures

FIGURE 1
FIGURE 1
Membrane growth measured by a FRET assay. (A) Standard curve of FRET efficiency as a function of mol % FRET dyes in oleate vesicles. Each point represents a separate vesicle preparation. The solid line indicates the fitted curve, y = 0.255 ln(x) + 2.26, r2 = 0.983. (B) Typical growth experiment after stopped-flow mixing. Oleate vesicles (3 mM) were mixed with micelles (final 3 mM). Data were recorded every 0.3 s and converted into ΔSA using the FRET standard curve. The solid line indicates the fitted double exponential curve for this trial: A = 0.48, B = 0.33, k1 = 1.6/s, k2 = 0.08/s (see text for definitions), and r = 0.955. Four replicates were done for each set of conditions. (Inset) Closer view of the first 4 s of the same experiment, showing the fast phase of growth.
FIGURE 2
FIGURE 2
Observed rate constants k1 and k2 during vesicle growth by direct micelle addition, measured by the FRET assay: k1 (A) and k2 (B) versus micelle concentration (3 mM oleate vesicles), k1 (C) and k2 (D) versus vesicle concentration (3 mM oleate micelles). The van't Hoff plots of initial reaction rate (v) and vesicle (E) or micelle (F) concentration for high micelle/vesicle ratios (>0.4). Straight lines indicate linear fits to (E) y = 0.95x − 0.36 (r2 = 0.98), and (F) y = 0.01x + 0.28 (r2 = 0.057). Error bars indicate 95% confidence intervals calculated from replicates.
FIGURE 3
FIGURE 3
Observed amplitudes A (fast phase) and B (slow phase) during vesicle growth by direct micelle addition, measured by the FRET assay. (A) Amplitudes versus micelle concentration (3 mM oleate vesicles). (B) Amplitudes versus vesicle concentration (3 mM oleate micelles). Error bars indicate 95% confidence intervals calculated from replicates. (C) Yield of vesicle growth by direct micelle addition as the amount of micelles added increases (3 mM oleate vesicles). The theoretical yield is the yield calculated by assuming that all micelles were incorporated into preformed vesicles.
FIGURE 4
FIGURE 4
Light scattering intensity increases during vesicle growth by direct micelle addition. (A) A typical example of light scattering intensity during the growth of preformed vesicles. At time zero, one equivalent of micelles were added to a solution of preformed vesicles (0.75 mM oleate in 0.2 M bicine, pH 8.5). (B and C) The timescales of the first and second stages, respectively, as the micelle concentration is varied. (D) The amplitudes of the first and second stages.
FIGURE 5
FIGURE 5
Characterization of micelles mixed with buffer at pH 8.5. (A) Pyrene emission spectrum of micelles mixed by stopped-flow. The monomer peaks can be seen at ∼374 nm, and the broader excimer peak can be seen at 470 nm. Micelles were mixed with 0.2 M bicine, pH 8.5. In the absence of oleate, pyrene fluorescence is much weaker. Control: micelles in 1 mM NaOH. (B) Autocorrelation data from DLS of micelles mixed with 0.2 M bicine, pH 8.5. The solid line is a cumulant fit up to the second moment (r2 = 0.997).
FIGURE 6
FIGURE 6
Growth of preformed vesicles using one equivalent of micelles preincubated for varying times in 0.2 M bicine, pH 8.5, as measured by the FRET assay. (A) Surface area increase versus micelle preincubation time; solid line indicates the fitted curve, y = 9.44 + 48.7 e−0.159(x), r2 = 0.996. (B) The rate constant of growth versus micelle preincubation time; solid line indicates the fitted curve, y = 1.66 e−0.085(x), r2 = 0.989.
FIGURE 7
FIGURE 7
Proposed scheme of dynamic processes occurring during micelle addition to preformed fatty acid vesicles.
Scheme
Scheme

References

    1. Allahyarov, E., I. D‘Amico, and H. Lowen. 1998. Attraction between like-charged macroions by Coulomb depletion. Phys. Rev. Lett. 81:1334–1337.
    1. Allen, W. V., and C. Ponnamperuma. 1967. A possible prebiotic synthesis of monocarboxylic acids. Curr. Mod. Biol. 1:24–28. - PubMed
    1. Almgren, M., F. Grieser, and J. K. Thomas. 1979. Dynamic and static aspects of solubilization of neutral arenes in ionic micellar solutions. J. Am. Chem. Soc. 101:279–291.
    1. An, S. W., J. R. Lu, and R. K. Thomas. 1996. Apparent anomalies in surface excesses determined from neutron reflection and the Gibbs equation in anionic surfactants with particular reference to perfluorooctanoates at the air/water interface. Langmuir. 12:2446–2453.
    1. Angelini, T. E., H. Liang, W. Wriggers, and G. C. L. Wong. 2003. Like-charge attraction between polyelectrolytes induced by counterion charge density waves. Proc. Natl. Acad. Sci. USA. 100:8634–8637. - PMC - PubMed

Publication types

LinkOut - more resources