Comparative Study
. 2004 Aug;87(2):1034-43.
doi: 10.1529/biophysj.104.040519.

Fluorescence correlation spectroscopy relates rafts in model and native membranes

Affiliations
Comparative Study

Fluorescence correlation spectroscopy relates rafts in model and native membranes

Kirsten Bacia et al. Biophys J. 2004 Aug.

Abstract

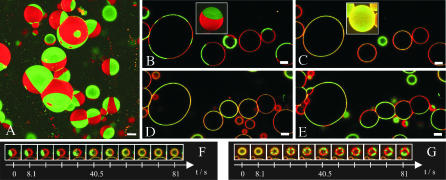
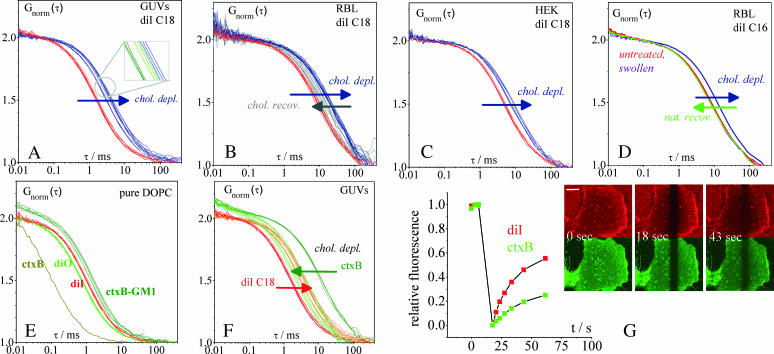
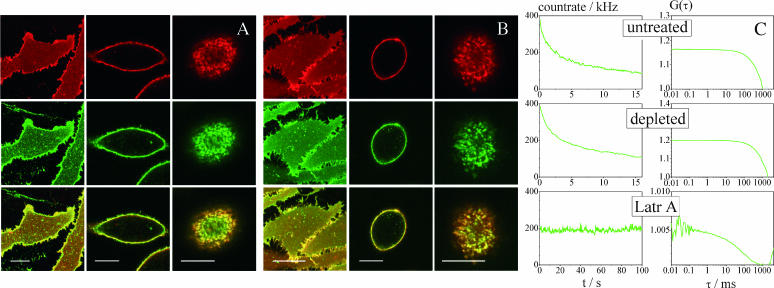
The lipid raft model has evoked a new perspective on membrane biology. Understanding the structure and dynamics of lipid domains could be a key to many crucial membrane-associated processes in cells. However, one shortcoming in the field is the lack of routinely applicable techniques to measure raft association without perturbation by detergents. We show that both in cell and in domain-exhibiting model membranes, fluorescence correlation spectroscopy (FCS) can easily distinguish a raft marker (cholera toxin B subunit bound to ganglioside (GM1) and a nonraft marker (dialkylcarbocyanine dye diI)) by their decidedly different diffusional mobilities. In contrast, these markers exhibit only slightly different mobilities in a homogeneous artificial membrane. Performing cholesterol depletion with methyl-beta-cyclodextrin, which disrupts raft organization, we find an analogous effect of reduced mobility for the nonraft marker in domain-exhibiting artificial membranes and in cell membranes. In contrast, cholesterol depletion has differential effects on the raft marker, cholera toxin B subunit-GM1, rendering it more mobile in artificial domain-exhibiting membranes but leaving it immobile in cell membranes, where cytoskeleton disruption is required to achieve higher mobility. Thus, fluorescence correlation spectroscopy promises to be a valuable tool to elucidate lipid raft associations in native cells and to gain deeper insight into the correspondence between model and natural membranes.


Figures

FIGURE 1
FIGURE 1
GUVs exhibit phase separation into Ld (red) and Lo (green) domains that is reversibly removed by in situ cholesterol extraction. All scale bars = 10 μm. Fig. 1 A shows a three-dimensional reconstruction of giant unilamellar vesicles from confocal slices. GUVs were prepared from DOPC/SM/cholesterol = 1:1:1 with the addition of diIC18 and GM1 in trace amounts. CtxB-488, which binds to GM1, has been added after the preparation. DiIC18 fluorescence is depicted in red and ctxB-488 fluorescence in green. As the vesicles, which were produced above the melting temperature of the lipid mixture, approach room temperature, domains grow large. Spherical domain borders confirm the coexistence of two liquid phases (Lo and Ld). Fig. 1, B and C, represents confocal slice images (insets: three-dimensional reconstructions) of GUVs prepared from the same composition, before and after addition of MβCD, a cholesterol-sequestering agent. Cholesterol depletion results in GUVs that are uniformly labeled with both probes (red: diI; green: GM1-ctxB-488; and yellow: overlay). The slightly stronger red fluorescence on the right and left sides of GUVs in the confocal sections (Fig. 1, BE) is due to the polarization of the laser light and the orientations of the diI chromophores in the membrane. It does not indicate an uneven distribution of diI in Fig. 1, C and D. During the time course of cholesterol depletion (Fig. 1 F), dissolution appears to be initiated at the borderline between domains. The “lifesaver”-like appearance of this GUV (diameter ≈ 10 μm) stems from the confocal imaging of a slice below the top of the vesicle. Previously depleted GUVs (Fig. 1 D) are treated with cholesterol-loaded MβCD complex, resulting in a reappearance of domains (Fig. 1 E). Smaller domains emerge first and then coalesce (Fig. 1 G; GUV diameter ≈ 15 μm). The tendency of whole GUVs to attach to each other and fuse is probably due to osmotic effects or changes in lipid molecule numbers in the membrane.
FIGURE 2
FIGURE 2
In situ cholesterol depletion reduces the mobility of the nonraft marker diI both in GUVs and in native membranes. The red curves in Fig. 2 A represent diIC18 diffusion in the bright phase of raft mixture GUVs. After in situ cholesterol depletion, diffusion in the resulting homogeneous phase is slower (blue curves; see also summary of all data in Table 1). The blow-up displays curves taken on the same vesicle in a distinct color: Even the slight differences in mobility between single vesicles due to variations in lipid composition are detected demonstrating the high sensitivity achievable by FCS analysis. Fig. 2 B show the diffusion of the same marker, diIC18, measured on live RBL cell plasma membranes (red curves). Absolute marker mobility is distinct from the one observed in GUVs. When cholesterol is depleted by MβCD treatment, marker diffusion becomes slower. The addition of complexed cholesterol to previously depleted cells causes diI to become more mobile again, but mobility is still lower than in cells with natural cholesterol content. Fig. 2 C depicts the cholesterol depletion experiment performed on a different cell line (HEK 293). Again, diIC18 diffusion is slower after cholesterol depletion, which agrees with the findings on the RBL cells. Fig. 2 D shows the effect of cholesterol depletion on the diffusion of diIC16 in RBL cell plasma membranes (both red lines: untreated cells; blue line: MβCD treated cells). This experiment demonstrates that diIC16, which was assumed to be a raft marker by Hao et al. (2001), behaves qualitatively the same as diIC18. Fig. 2 D also contains three more control experiments. For clarity, only average curves are depicted. 1), Mobility for a given cell line is very reproducible, as the averages of two sets of measurements recorded on two different days (red lines) show. 2), DiI marker mobility in previously cholesterol depleted cells was found to be completely restored when cells were allowed to recover naturally in serum-supplemented media (green line). 3), Hypo-osmotic swelling (gray line) had no significant effect on diI mobility in comparison with untreated cells. Fig. 2 E demonstrates that the diffusion of ctxB-488 that binds to a maximum of five GM1 molecules is only twofold slower in a homogeneous artificial membrane (DOPC) than the diffusion of diIC18 or diOC18. (See also summary of all data in Table 1.) The markers diIC18 and diOC18, which are structurally similar but have different fluorescent spectra, are assumed to possess the same mobility (D = 7 × 10⁻⁸ cm2/s). However, diI is observed to bear a longer diffusion time (red lines) than diO (left green lines), which is due to the wavelength dependence of the focal area. Therefore, when comparing ctxB-GM1 mobility to diI mobility in FCS curves by eye, the relation of diI and diO curves needs to be borne in mind. This complication does not arise in the comparison of diffusion coefficients, where the calibration of the detection volume has already been accounted for (Table 1). To allow direct visual comparison of diffusion decays in the case of membrane-bound ctxB, where an additional contribution of unbound ctxB is observed in the curves, normalization has been carried out with respect to the slow-diffusing component. The contributions were quantitated using a two-component fit, in which the diffusion time of the fast component was known from a separate measurement (gray line: τD = 110 μs and D = 5.0 × 10⁻⁷ cm2/s). The relative amplitude of free ctxB, which appears as a shoulder in the ctxB-curves at shorter times, depends on the concentration of ctxB added to the GUVs in the particular experiment. It was Ffree = (7.9 ± 1.1)% in Fig. 2 E and Ffree = (9.6 ± 0.8)% in Fig. 2 F. Fig. 2 F shows that ctxB-GM1 has a considerably lower mobility in the Lo domains of raft mixture GUVs (dark green curves) than in the homogeneous DOPC membrane (Fig. 2 E). When domain separation is abolished by cholesterol depletion, mobility greatly increases (bright green curves). For comparison, the FCS curves showing the decrease in mobility of diI in its phase of enrichment (Ld, red curves) versus the homogeneous phase after depletion (orange curves) are shown again, the same as in Fig. 2 A. Fig. 2 G shows a FRAP experiment performed on the bottom membrane of an HEK 293 cell, double-labeled with diIC18 and ctxB-488. Both markers were bleached simultaneously in a rectangular area. The recovery of diI is obviously faster than that of ctxB-488 as seen in the representative images and in the fluorescence quantitation from the bleached region of interest (fluorescence was set relative to a control region, bleach depth was scaled to 100%, and the scale bar =10 μm).
FIGURE 3
FIGURE 3
Confocal scanning microscopy does not show phase separation in native cell membranes; FCS reveals low, cytoskeleton-dependent mobility of cholera toxin in native membranes. (A) Images of a live RBL cell immediately after double labeling with diIC18 (red) and ctxB-488 (green) in the native cholesterol state were taken at the bottom membrane near the coverslip (left column), at the equatorial plane (middle column), and at the top membrane (right column). Scale bar = 10 μm. The same kind of confocal sections were obtained of a cell in the cholesterol-depleted state (B). Evidently, diI and ctxB do not become enriched in microscopically visible, counterstained domains, as seen from the overlays in the bottom rows of A and B. However, at the upper side of the cell (right bottom images), there is colocalized staining, probably arising from membrane topology. Note that cell morphology changes upon cholesterol depletion (middle columns). Similarly, cells became more rounded under conditions of hypo-osmotic swelling (not shown). The upper left graph in Fig. 3 C shows the fluorescence count-rate trace of an attempted FCS measurement on the membrane of an RBL cell. There is strong photobleaching even at low laser powers, confirming very low ctxB-GM1 mobility (τD > 70 ms and D < 1 × 10⁻⁹ cm2/s). The loss in fluorescence leads to an artifactual decay in the correlation curve (upper right graph) that cannot be interpreted by standard FCS models. The middle graphs of C depict a representative attempt to measure the mobility of ctxB on an RBL cell after cholesterol depletion with MβCD. Despite this treatment, which is assumed to disrupt raft integrity, the low mobility of ctxB-GM1 clearly remains. In contrast, when actin cytoskeleton was disrupted by Latrunculin A treatment, ctxB-GM1 tended to be more mobile: The bottom graphs in C show a count rate that does not decay and an FCS curve that is not corrupted by bleaching.

Similar articles

Cited by

References

    1. Avery, J., D. J. Ellis, T. Lang, P. Holyroyd, D. Riedel, R. M. Henderson, J. M. Edwardson, and R. Jahn. 2000. A cell-free system for regulated exocytosis in PC12 cells. J. Cell Biol. 148:317–324. - PMC - PubMed
    1. Axelrod, D. 1977. Cell surface heating during fluorescence photobleaching recovery experiments. Biophys. J. 18:130–131. - PMC - PubMed
    1. Bacia, K., I. V. Majoul, and P. Schwille. 2002. Probing the endocytic pathway in live cells using dual-color fluorescence cross-correlation analysis. Biophys. J. 83:1184–1193. - PMC - PubMed
    1. Bacia, K., and P. Schwille. 2003. A dynamic view of cellular processes by in vivo fluorescence auto- and cross-correlation spectroscopy. Methods. 29:74–85. - PubMed
    1. Braccia, A., M. Villani, L. Immerdahl, L. L. Niels-Christiansen, B. T. Nystrom, G. H. Hansen, and E. M. Danielsen. 2003. Microvillar membrane microdomains exist at physiological temperature. Role of galectin-4 as lipid raft stabilizer revealed by “superrafts”. J. Biol. Chem. 278:15679–15684. - PubMed

Publication types

MeSH terms

LinkOut - more resources