

Self-assembly of the ionic peptide EAK16: the effect of charge distributions on self-assembly
- PMID: 15298927
- PMCID: PMC1304463
- DOI: 10.1529/biophysj.103.038166
Self-assembly of the ionic peptide EAK16: the effect of charge distributions on self-assembly
Abstract
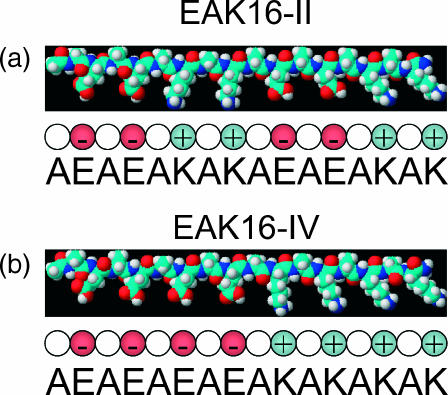
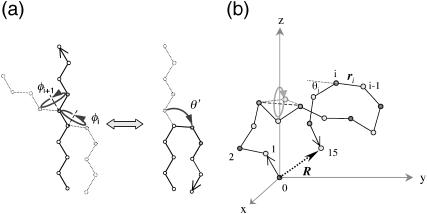
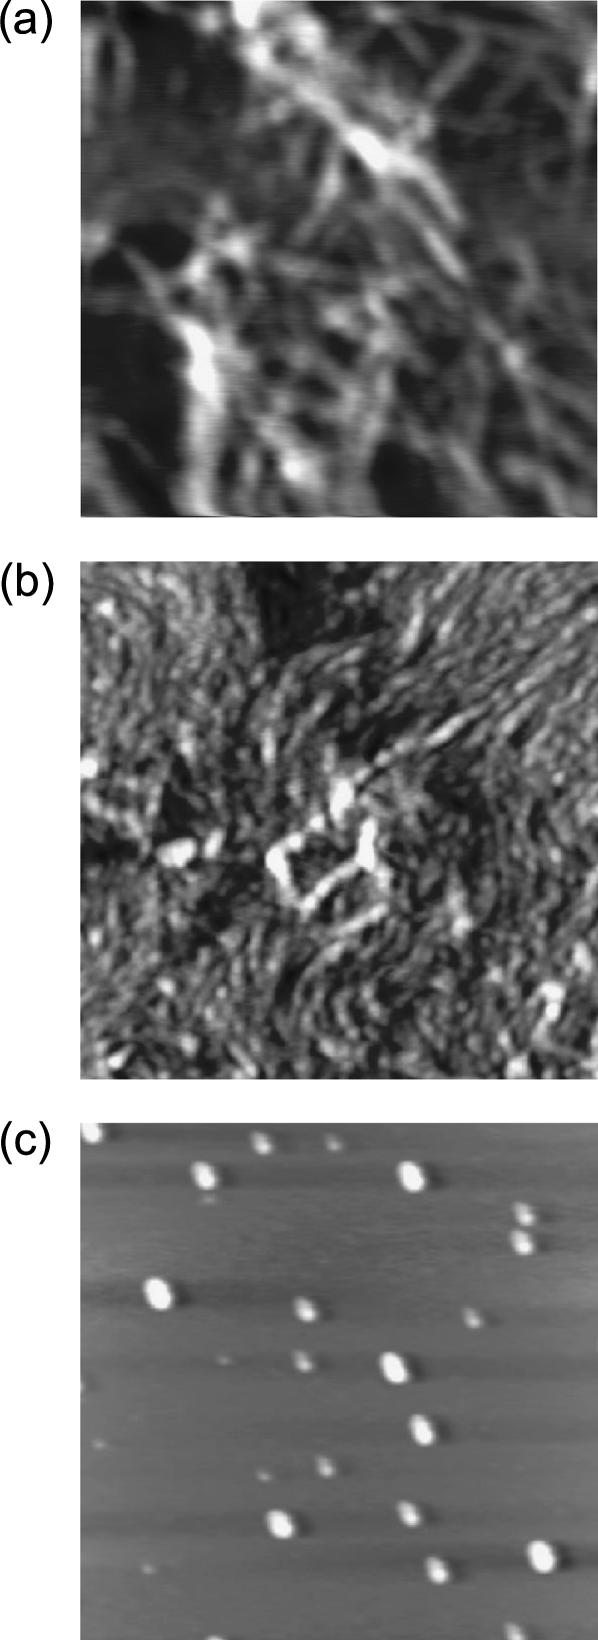
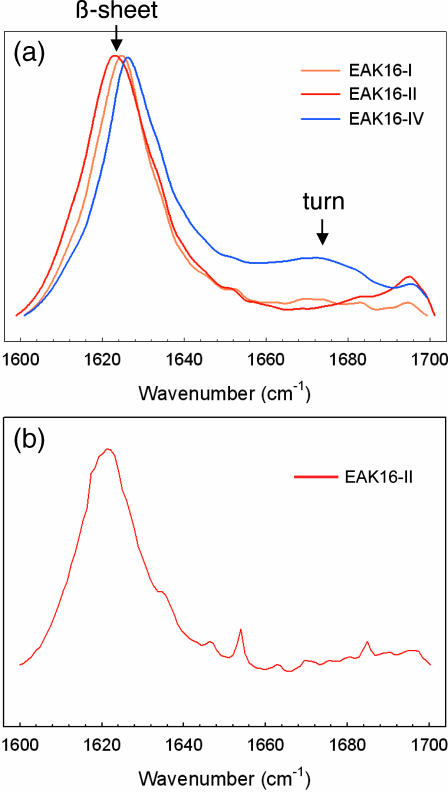
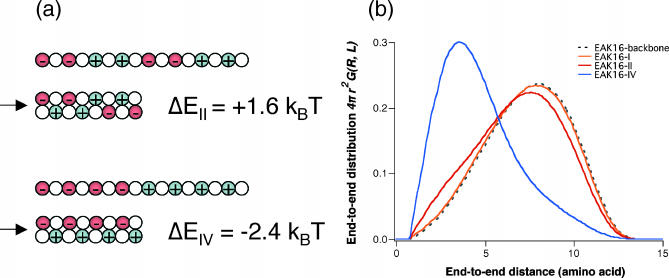
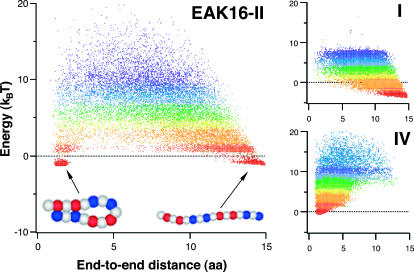
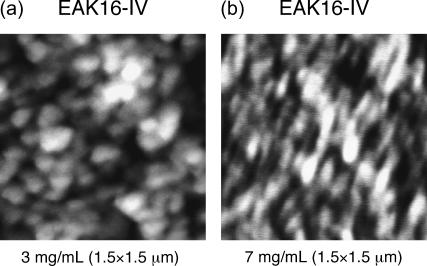
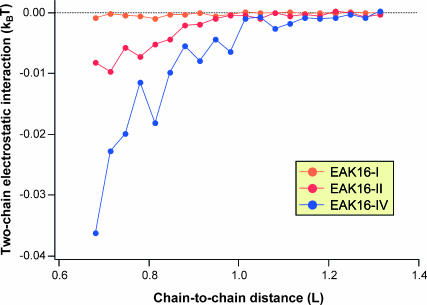
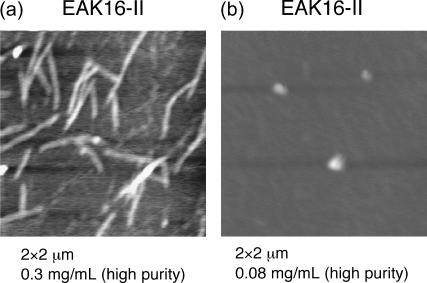
Amphiphilic peptides suspended in aqueous solution display a rich set of aggregation behavior. Molecular-level studies of relatively simple amphiphilic molecules under controlled conditions are an essential step toward a better understanding of self-assembly phenomena of naturally occurring peptides/proteins. Here, we study the influence of molecular architecture and interactions on the self-assembly of model peptides (EAK16s), using both experimental and theoretical approaches. Three different types of EAK16 were studied: EAK16-I, -II, and -IV, which have the same amino acid composition but different amino acid sequences. Atomic force microscopy confirms that EAK16-I and -II form fibrillar assemblies, whereas EAK16-IV forms globular structures. The Fourier transform infrared spectrum of EAK16-IV indicates the possible formation of a beta-turn structure, which is not found in EAK16-I and -II. Our theoretical and numerical studies suggest the underlying mechanism behind these observations. We show that the hairpin structure is energetically stable for EAK16-IV, whereas the chain entropy of EAK16-I and -II favors relatively stretched conformations. Our combined experimental and theoretical approaches provide a clear picture of the interplay between single-chain properties, as determined by peptide sequences (or charge distributions), and the emerging structure at the nano (or more coarse-grained) level.
Figures
Similar articles
-
Effect of amino acid sequence and pH on nanofiber formation of self-assembling peptides EAK16-II and EAK16-IV.Biomacromolecules. 2003 Sep-Oct;4(5):1433-42. doi: 10.1021/bm0341374. Biomacromolecules. 2003. PMID: 12959616
-
Mechanisms of the self-assembly of EAK16-family peptides into fibrillar and globular structures: molecular dynamics simulations from nano- to micro-seconds.Eur Biophys J. 2015 May;44(4):263-76. doi: 10.1007/s00249-015-1024-y. Epub 2015 Apr 2. Eur Biophys J. 2015. PMID: 25833089
-
Surface-driven first-step events of nanoscale self-assembly for molecular peptide fibers: An experimental and theoretical study.Colloids Surf B Biointerfaces. 2018 Aug 1;168:148-155. doi: 10.1016/j.colsurfb.2018.01.016. Epub 2018 Feb 1. Colloids Surf B Biointerfaces. 2018. PMID: 29395383
-
Peptide self-assembly at the nanoscale: a challenging target for computational and experimental biotechnology.Trends Biotechnol. 2007 May;25(5):211-8. doi: 10.1016/j.tibtech.2007.03.004. Epub 2007 Mar 26. Trends Biotechnol. 2007. PMID: 17379339 Review.
-
Peptides with regular enantiomeric sequences: a wide class of modular self-assembling architectures.J Nanosci Nanotechnol. 2007 Jul;7(7):2230-8. doi: 10.1166/jnn.2007.644. J Nanosci Nanotechnol. 2007. PMID: 17663235 Review.
Cited by
-
Peptide Hydrogels - Versatile Matrices for 3D Cell Culture in Cancer Medicine.Front Oncol. 2015 Apr 20;5:92. doi: 10.3389/fonc.2015.00092. eCollection 2015. Front Oncol. 2015. PMID: 25941663 Free PMC article. Review.
-
Molecular dynamics simulation of semiflexible polyampholyte brushes--the effect of charged monomers sequence.Eur Phys J E Soft Matter. 2009 Jun;29(2):131-8. doi: 10.1140/epje/i2009-10458-x. Epub 2009 May 23. Eur Phys J E Soft Matter. 2009. PMID: 19466471
-
Self-Assembling Peptide Gels for 3D Prostate Cancer Spheroid Culture.Macromol Biosci. 2019 Jan;19(1):e1800249. doi: 10.1002/mabi.201800249. Epub 2018 Oct 15. Macromol Biosci. 2019. PMID: 30324687 Free PMC article.
-
Photoinduced Hydrogel-Forming Caged Peptides with Improved Solubility.ACS Omega. 2024 Jan 30;9(6):6894-6900. doi: 10.1021/acsomega.3c08289. eCollection 2024 Feb 13. ACS Omega. 2024. PMID: 38371799 Free PMC article.
-
Self-assembly of rationally designed peptides under two-dimensional confinement.Biophys J. 2010 Nov 3;99(9):2888-95. doi: 10.1016/j.bpj.2010.08.061. Biophys J. 2010. PMID: 21044586 Free PMC article.
References
-
- Barrat, J.-L., and J.-F. Joanny. 1996. Theory of polyelectrolyte solution. Adv. Chem. Phys. 94:1–66 (and references therein.).
-
- Bartels, C., M. Schaefer, and M. Karplus. 1999. Multidimensional adaptive umbrella sampling. J. Chem. Phys. 111:8048–8067.
-
- Bright, J. N., T. B. Woolf, and J. H. Hoh. 2001. Predicting properties of intrinsically unstructured proteins. Prog. Biophys. Mol. Biol. 76:131–173. - PubMed
-
- Byler, D. M., and H. Susi. 1986. Examination of the secondary structure of proteins by deconvoluted FTIR spectra. Biopolymers. 25:469–487. - PubMed
-
- Caplan, M. R., P. N. Moore, S. Zhang, R. D. Kamm, and D. A. Lauffenburger. 2000. Self-assembly of a β-sheet protein governed by relief of electrostatic repulsion relative van der Waals attraction. Biomacromolecules. 1:627–631. - PubMed
Publication types
MeSH terms
Substances
LinkOut - more resources
Full Text Sources
