. 2004 Aug;135(4):2279-90.
doi: 10.1104/pp.104.040493. Epub 2004 Aug 6.

Disorganization of cortical microtubules stimulates tangential expansion and reduces the uniformity of cellulose microfibril alignment among cells in the root of Arabidopsis

Affiliations

Disorganization of cortical microtubules stimulates tangential expansion and reduces the uniformity of cellulose microfibril alignment among cells in the root of Arabidopsis

Tobias I Baskin et al. Plant Physiol. 2004 Aug.

Abstract

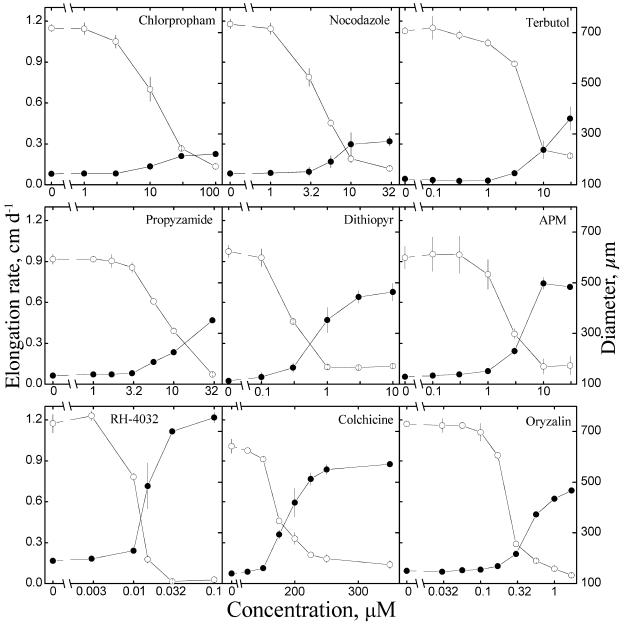
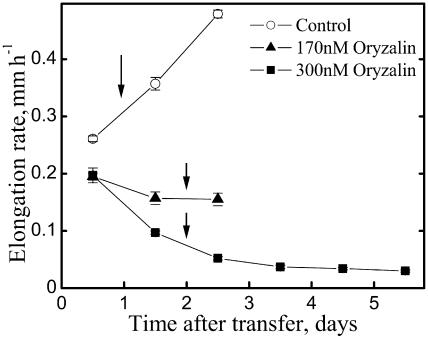
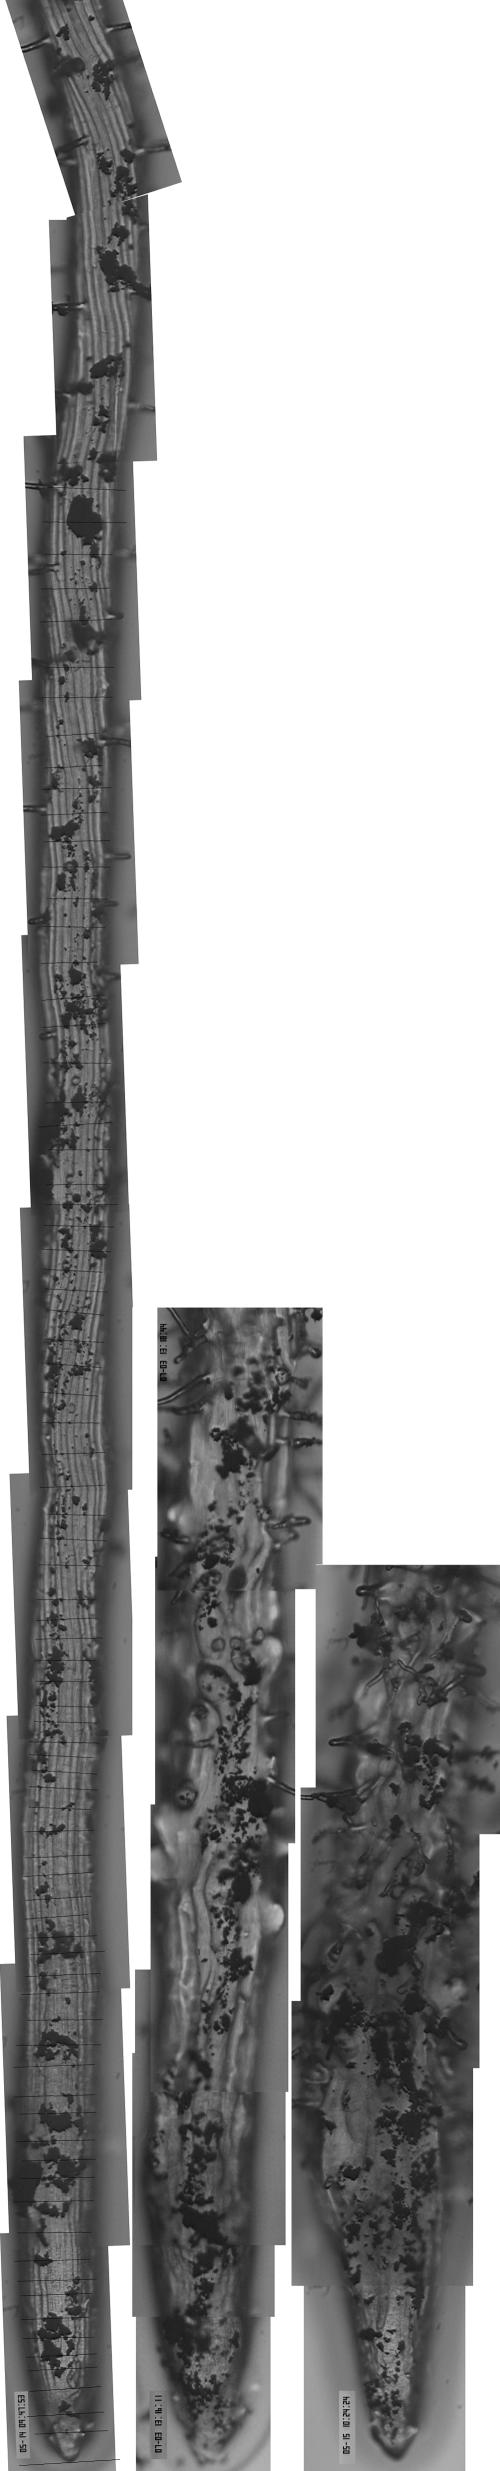
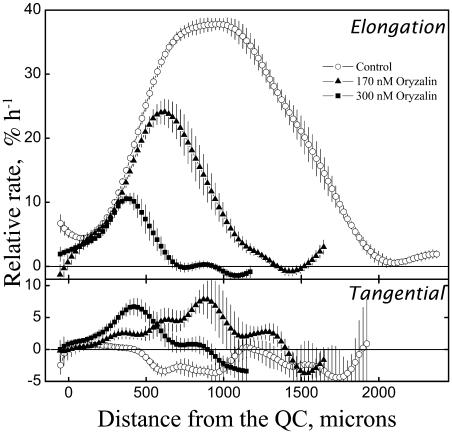
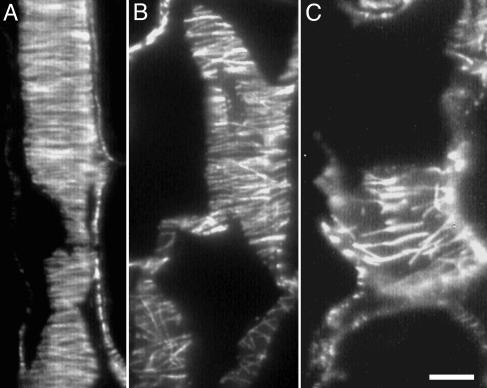
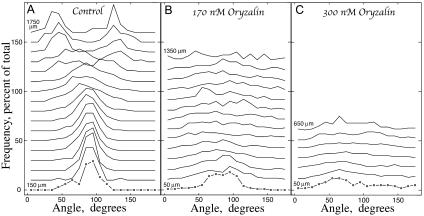
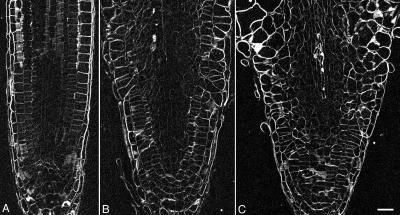
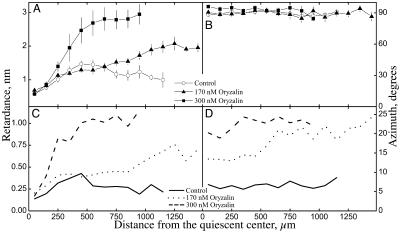
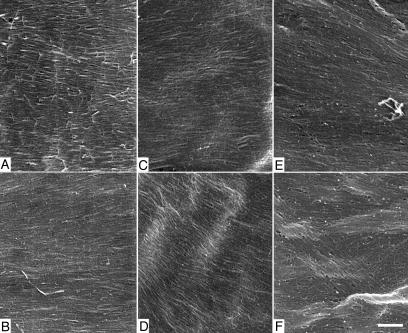
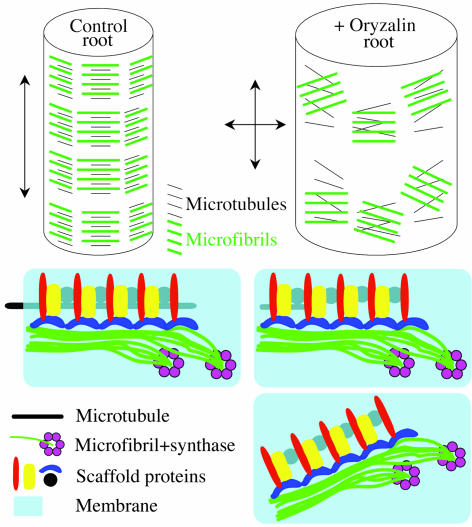
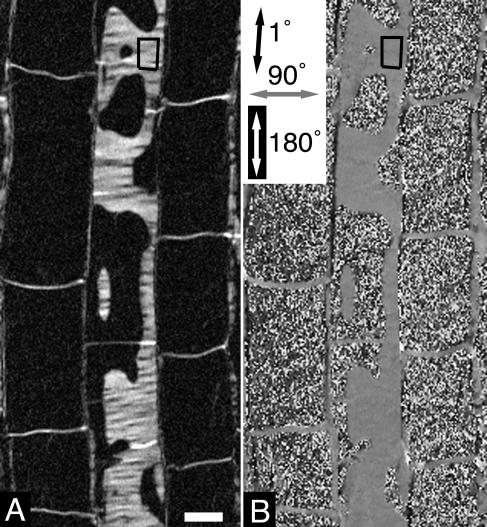
To test the role of cortical microtubules in aligning cellulose microfibrils and controlling anisotropic expansion, we exposed Arabidopsis thaliana roots to moderate levels of the microtubule inhibitor, oryzalin. After 2 d of treatment, roots grow at approximately steady state. At that time, the spatial profiles of relative expansion rate in length and diameter were quantified, and roots were cryofixed, freeze-substituted, embedded in plastic, and sectioned. The angular distribution of microtubules as a function of distance from the tip was quantified from antitubulin immunofluorescence images. In alternate sections, the overall amount of alignment among microfibrils and their mean orientation as a function of position was quantified with polarized-light microscopy. The spatial profiles of relative expansion show that the drug affects relative elongation and tangential expansion rates independently. The microtubule distributions averaged to transverse in the growth zone for all treatments, but on oryzalin the distributions became broad, indicating poorly organized arrays. At a subcellular scale, cellulose microfibrils in oryzalin-treated roots were as well aligned as in controls; however, the mean alignment direction, while consistently transverse in the controls, was increasingly variable with oryzalin concentration, meaning that microfibril orientation in one location tended to differ from that of a neighboring location. This conclusion was confirmed by direct observations of microfibrils with field-emission scanning electron microscopy. Taken together, these results suggest that cortical microtubules ensure microfibrils are aligned consistently across the organ, thereby endowing the organ with a uniform mechanical structure.


Figures

Figure 1.
Figure 1.
Comparison of the effects of microtubule inhibitors on Arabidopsis root growth. Seedlings were transferred to inhibitor plates and elongation rate (white circles) measured over the second 24 h of treatment and diameter (black circles) measured at the end of that period. Symbols plot mean ± se from three replicate experiments or in most cases from three replicate plates. Concentration is plotted logarithmically except for colchicine. Control diameter and elongation rate differed among the experiments for unknown reasons.
Figure 2.
Figure 2.
Time course of root elongation following transfer to oryzalin or control plates. Seven-day-old seedlings were transferred at time zero and elongation rate measured at 24 h intervals and plotted at the mid-point time. Arrows show the times when samples were fixed. Symbols plot mean ± se of three plates.
Figure 3.
Figure 3.
Bright-field, composite micrographs of roots used for growth analysis, sampled as described for Figure 2. Left image shows control, center shows 170 nm oryzalin, and right shows 300 nm oryzalin. Black spots on the roots are the graphite particles used to measure local velocities. Roughly horizontal black lines on control were applied manually to aid measurement (see Beemster and Baskin, 1998). Control root is approximately 150 μm in diameter.
Figure 4.
Figure 4.
Spatial profiles of relative elongation rate (top) and tangential expansion rate (bottom). Data plot mean ± se (when larger than the symbol) for 5 replicate roots. QC, Quiescent center. Material was taken for growth analysis at the times given in Figure 2.
Figure 5.
Figure 5.
Fluorescence micrographs of cortical microtubules in root cortex cells within the elongation zone, representative of the treatments. Methacrylate sections stained with an antitubulin antibody. The root's long axis is parallel to the long side of the page. Material was sampled according to Figure 2. A, Control; B, 170 nm oryzalin; C, 300 nm oryzalin. Bar represents 10 μm.
Figure 6.
Figure 6.
Frequency distributions of microtubule angle as a function of position. The root's long axis is defined as 0°. Angles were binned in 10° intervals, starting at 0° and plotted at the midpoint. Distances of the measured arrays were binned in 100-μm intervals, starting at the quiescent center or, for controls, at 100 μm from there. Distributions reflect pooled data from six roots, with 5,600 to 8,200 microtubules per treatment. Symbols are shown only on the apical-most distributions. Each distribution was normalized as percent of its maximum and successive distributions are displaced on the ordinate by 10%. Data are for cortex and epidermis. Material sampled according to Figure 2.
Figure 7.
Figure 7.
Polarized-light micrographs (retardance images) of the root tip. Methacrylate sections of material sampled according to Figure 2. A, Control; B, 170 nm oryzalin; C, 300 nm oryzalin. Bar represents 20 μm.
Figure 8.
Figure 8.
Retardance (A and C) and azimuth (B and D) as a function of position. Data in A and B plot the mean ± se for four (control and 300 nm oryzalin) or five roots. For C and D, the sds for the 20 to 80 measurements at each position were obtained for each root, averaged over the roots, and plotted without symbols. Data are for cortex and epidermis. Material was sampled according to Figure 2.
Figure 9.
Figure 9.
FESEM micrographs of the innermost cell wall layer taken within the growth zone. A and B, Control; C and D, 170 nm oryzalin; E and F, 300 nm oryzalin. The long axis of the root is parallel to the long side of the page. For the oryzalin treatments, images are representative of least affected (upper) and most affected (lower) cell walls. All images are from cortex or epidermis. Material was sampled according to Figure 2. Bar represents 250 nm.
Figure 10.
Figure 10.
Relations between microtubules, microfibrils, and growth anisotropy. Top, Global level. On the left, the control root has a uniformly transverse alignment among microtubules and microfibrils, and highly anisotropic expansion (double-headed arrow to left). On the right, root treated with low oryzalin has partially disorganized microtubules and microfibrils that are well aligned locally but not globally. We hypothesize that the loss of uniform global alignment among microfibrils increases the rate of tangential expansion (double-headed arrows to left of root). Bottom, Model for the local level. On the left, the control, cortical microtubule organizes a scaffold of membrane proteins, some of which interact with the nascent microfibril to orient it. A second microfibril is oriented by self-assembly with respect to the first one. On the right, under oryzalin treatment, a short microtubule is able to maintain the scaffold's integrity, whereas at lower right, without a microtubule, the scaffold rotates as a whole and leads to locally coherent microfibril realignment. Viewed from the cell wall looking in, with microtubules and some of the scaffold lying beneath the membrane.
Figure 11.
Figure 11.
Polarized-light micrographs of a region of the root cortex illustrating the output of the LC-Pol Scope and the method of sampling. From a stack of four images (not shown) the instrument calculates digitally a pair of images in which the intensity of each pixel is proportional to (A) retardance and (B) azimuth of the optical axis of the birefringent element. Inset in the azimuth image shows the gray level coding. Boxes shown are typical of those used for measurement. The black (low retardance) throughout most cells in (A) reflects the absence of cell wall. Bar represents 10 μm.

Similar articles

Cited by

References

    1. Baskin TI (2001) On the alignment of cellulose microfibrils by cortical microtubules: a review and a model. Protoplasma 215: 150–171 - PubMed
    1. Baskin TI, Beemster GTS (1998) On the “postmitotic isodiametric growth zone” in roots. In HE Flores, J Lynch, D Eissenstat, eds, Radical Biology, Advances and Perspectives on the Function of Plant Roots. American Society of Plant Physiologists, Rockville MD, pp 23–33
    1. Baskin TI, Meekes HTHM, Liang BM, Sharp RE (1999) Regulation of growth anisotropy in well-watered and water-stressed maize roots. II. Role of cortical microtubules and cellulose microfibrils. Plant Physiol 119: 681–692 - PMC - PubMed
    1. Baskin TI, Miller DD, Vos JW, Wilson JE, Hepler PK (1996) Cryofixing single cells and multicellular specimens enhances structure and immunocytochemistry for light microscopy. J Microsc 182: 149–161 - PubMed
    1. Baskin TI, Wilson JE (1997) Inhibitors of protein kinases and phosphatases alter root morphology and disorganize cortical microtubules. Plant Physiol 113: 493–502 - PMC - PubMed

Publication types

MeSH terms

LinkOut - more resources