

Structure of the photolyase-like domain of cryptochrome 1 from Arabidopsis thaliana
- PMID: 15299148
- PMCID: PMC514401
- DOI: 10.1073/pnas.0404851101
Structure of the photolyase-like domain of cryptochrome 1 from Arabidopsis thaliana
Abstract
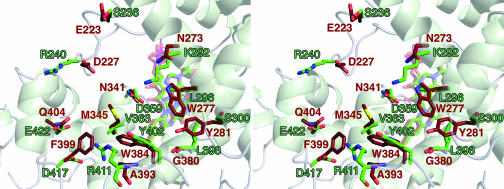
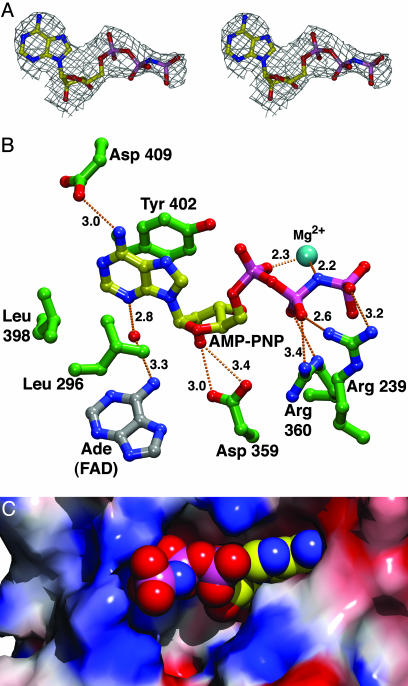
Signals generated by cryptochrome (CRY) blue-light photoreceptors are responsible for a variety of developmental and circadian responses in plants. The CRYs are also identified as circadian blue-light photoreceptors in Drosophila and components of the mammalian circadian clock. These flavoproteins all have an N-terminal domain that is similar to photolyase, and most have an additional C-terminal domain of variable length. We present here the crystal structure of the photolyase-like domain of CRY-1 from Arabidopsis thaliana. The structure reveals a fold that is very similar to photolyase, with a single molecule of FAD noncovalently bound to the protein. The surface features of the protein and the dissimilarity of a surface cavity to that of photolyase account for its lack of DNA-repair activity. Previous in vitro experiments established that the photolyase-like domain of CRY-1 can bind Mg.ATP, and we observe a single molecule of an ATP analog bound in the aforementioned surface cavity, near the bound FAD cofactor. The structure has implications for the signaling mechanism of CRY blue-light photoreceptors.
Figures


Similar articles
-
Crystal structure of cryptochrome 3 from Arabidopsis thaliana and its implications for photolyase activity.Proc Natl Acad Sci U S A. 2006 Nov 21;103(47):17701-6. doi: 10.1073/pnas.0608554103. Epub 2006 Nov 13. Proc Natl Acad Sci U S A. 2006. PMID: 17101984 Free PMC article.
-
Light-induced electron transfer in Arabidopsis cryptochrome-1 correlates with in vivo function.J Biol Chem. 2005 May 20;280(20):19437-40. doi: 10.1074/jbc.C500077200. Epub 2005 Mar 17. J Biol Chem. 2005. PMID: 15774475
-
Functional motifs in the (6-4) photolyase crystal structure make a comparative framework for DNA repair photolyases and clock cryptochromes.Proc Natl Acad Sci U S A. 2009 Apr 28;106(17):6962-7. doi: 10.1073/pnas.0809180106. Epub 2009 Apr 9. Proc Natl Acad Sci U S A. 2009. PMID: 19359474 Free PMC article.
-
Cryptochrome signaling in plants.Photochem Photobiol. 2007 Jan-Feb;83(1):94-101. doi: 10.1562/2006-02-28-IR-826. Photochem Photobiol. 2007. PMID: 17002522 Review.
-
Structure and function of animal cryptochromes.Cold Spring Harb Symp Quant Biol. 2007;72:119-31. doi: 10.1101/sqb.2007.72.015. Cold Spring Harb Symp Quant Biol. 2007. PMID: 18419269 Review.
Cited by
-
Arabidopsis cryptochrome 2 completes its posttranslational life cycle in the nucleus.Plant Cell. 2007 Oct;19(10):3146-56. doi: 10.1105/tpc.107.053017. Epub 2007 Oct 26. Plant Cell. 2007. PMID: 17965271 Free PMC article.
-
Structural insights into BIC-mediated inactivation of Arabidopsis cryptochrome 2.Nat Struct Mol Biol. 2020 May;27(5):472-479. doi: 10.1038/s41594-020-0410-z. Epub 2020 May 11. Nat Struct Mol Biol. 2020. PMID: 32398826
-
ATP binding turns plant cryptochrome into an efficient natural photoswitch.Sci Rep. 2014 Jun 5;4:5175. doi: 10.1038/srep05175. Sci Rep. 2014. PMID: 24898692 Free PMC article.
-
Photoreaction Mechanisms of Flavoprotein Photoreceptors and Their Applications.Adv Exp Med Biol. 2021;1293:189-206. doi: 10.1007/978-981-15-8763-4_11. Adv Exp Med Biol. 2021. PMID: 33398814 Review.
-
Tripping the light fantastic: blue-light photoreceptors as examples of environmentally modulated protein-protein interactions.Biochemistry. 2011 Jan 11;50(1):4-16. doi: 10.1021/bi101665s. Epub 2010 Dec 14. Biochemistry. 2011. PMID: 21141905 Free PMC article. Review.
References
-
- Gyula, P., Schafer, E. & Nagy, F. (2003) Curr. Opin. Plant Biol. 6, 446-452. - PubMed
-
- Cashmore, A. R., Jarillo, J. A., Wu, Y.-J. & Liu, D. (1999) Science 284, 760-765. - PubMed
-
- Brudler, R., Hitomi, K., Daiyasu, H., Toh, H., Kucho, K., Ishiura, M., Kanehisa, M., Roberts, V. A., Todo, T., Tainer, J. A. & Getzoff, E. D. (2003) Mol. Cell 11, 59-67. - PubMed
-
- Malhotra, K., Kim, S.-T., Batschauer, A., Dawut, L. & Sancar, A. (1995) Biochemistry 34, 6892-6899. - PubMed
Publication types
MeSH terms
Substances
Associated data
- Actions
- Actions
LinkOut - more resources
Full Text Sources
Molecular Biology Databases
Research Materials
