Aberrant CBFA2T3B gene promoter methylation in breast tumors
- PMID: 15301688
- PMCID: PMC516017
- DOI: 10.1186/1476-4598-3-22
Aberrant CBFA2T3B gene promoter methylation in breast tumors
Abstract
Background: The CBFA2T3 locus located on the human chromosome region 16q24.3 is frequently deleted in breast tumors. CBFA2T3 gene expression levels are aberrant in breast tumor cell lines and the CBFA2T3B isoform is a potential tumor suppressor gene. In the absence of identified mutations to further support a role for this gene in tumorigenesis, we explored whether the CBFA2T3B promoter region is aberrantly methylated and whether this correlates with expression.
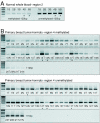
Results: Aberrant hypo and hypermethylation of the CBFA2T3B promoter was detected in breast tumor cell lines and primary breast tumor samples relative to methylation index interquartile ranges in normal breast counterpart and normal whole blood samples. A statistically significant inverse correlation between aberrant CBFA2T3B promoter methylation and gene expression was established.
Conclusion: CBFA2T3B is a potential breast tumor suppressor gene affected by aberrant promoter methylation and gene expression. The methylation levels were quantitated using a second-round real-time methylation-specific PCR assay. The detection of both hypo and hypermethylation is a technicality regarding the methylation methodology.
Figures


Similar articles
-
Down-regulation of LATS1 and LATS2 mRNA expression by promoter hypermethylation and its association with biologically aggressive phenotype in human breast cancers.Clin Cancer Res. 2005 Feb 15;11(4):1380-5. doi: 10.1158/1078-0432.CCR-04-1773. Clin Cancer Res. 2005. PMID: 15746036
-
Wnt signalling in human breast cancer: expression of the putative Wnt inhibitor Dickkopf-3 (DKK3) is frequently suppressed by promoter hypermethylation in mammary tumours.Breast Cancer Res. 2008;10(5):R82. doi: 10.1186/bcr2151. Epub 2008 Sep 30. Breast Cancer Res. 2008. PMID: 18826564 Free PMC article.
-
RASSF1A promoter methylation and expression analysis in normal and neoplastic kidney indicates a role in early tumorigenesis.Mol Cancer. 2007 Jul 16;6:49. doi: 10.1186/1476-4598-6-49. Mol Cancer. 2007. PMID: 17634119 Free PMC article.
-
The tumor suppressor role of CTCF.J Cell Physiol. 2012 Feb;227(2):479-92. doi: 10.1002/jcp.22780. J Cell Physiol. 2012. PMID: 21465478 Review.
-
Breast Cancer Tumor Suppressors: A Special Emphasis on Novel Protein Nischarin.Cancer Res. 2015 Oct 15;75(20):4252-9. doi: 10.1158/0008-5472.CAN-15-1395. Epub 2015 Sep 21. Cancer Res. 2015. PMID: 26392073 Review.
Cited by
-
DNA methylation-related vitamin D receptor insensitivity in breast cancer.Cancer Biol Ther. 2010 Jul 1;10(1):44-53. doi: 10.4161/cbt.10.1.11994. Epub 2010 Jul 9. Cancer Biol Ther. 2010. PMID: 20431345 Free PMC article.
-
The silencing of RECK gene is associated with promoter hypermethylation and poor survival in hepatocellular carcinoma.Int J Biol Sci. 2012;8(4):451-8. doi: 10.7150/ijbs.4038. Epub 2012 Mar 3. Int J Biol Sci. 2012. PMID: 22419890 Free PMC article.
-
The transcriptional co-repressor myeloid translocation gene 16 inhibits glycolysis and stimulates mitochondrial respiration.PLoS One. 2013 Jul 1;8(7):e68502. doi: 10.1371/journal.pone.0068502. Print 2013. PLoS One. 2013. PMID: 23840896 Free PMC article.
-
Loss of MTG16a (CBFA2T3), a novel rDNA repressor, leads to increased ribogenesis and disruption of breast acinar morphogenesis.J Cell Mol Med. 2010 Jun;14(6A):1358-70. doi: 10.1111/j.1582-4934.2009.00982.x. Epub 2009 Dec 2. J Cell Mol Med. 2010. PMID: 19961547 Free PMC article.
-
Pancreatic cancer patient survival correlates with DNA methylation of pancreas development genes.PLoS One. 2015 Jun 3;10(6):e0128814. doi: 10.1371/journal.pone.0128814. eCollection 2015. PLoS One. 2015. PMID: 26039411 Free PMC article.
References
-
- Cleton-Jansen AM, Callen DF, Seshadri R, Goldup S, Mccallum B, Crawford J, Powell JA, Settasatian C, van Beerendonk H, Moerland EW, Smit VT, Harris WH, Millis R, Morgan NV, Barnes D, Mathew CG, Cornelisse CJ. Loss of heterozygosity mapping at chromosome arm 16q in 712 breast tumors reveals factors that influence delineation of candidate regions. Cancer Res. 2001;61:1171–1177. - PubMed
-
- Suzuki H, Komiya A, Emi M, Kuramochi H, Shiraishi T, Yatani R, Shimazaki J. Three distinct commonly deleted regions of chromosome arm 16q in human primary and metastatic prostate cancers. Genes Chromosomes Cancer. 1996;17:225–233. doi: 10.1002/(SICI)1098-2264(199612)17:4<225::AID-GCC4>3.3.CO;2-S. - DOI - PubMed
-
- Whitmore SA, Crawford J, Apostolou S, Eyre H, Baker E, Lower KM, Settasatian C, Goldup S, Seshadri R, Gibson RA, Mathew CG, Cleton-Jansen AM, Savoia A, Pronk JC, Auerbach AD, Doggett NA, Sutherland GR, Callen DF. Construction of a high-resolution physical and transcription map of chromosome 16q24.3: a region of frequent loss of heterozygosity in sporadic breast cancer. Genomics. 1998;50:1–8. doi: 10.1006/geno.1998.5316. - DOI - PubMed
-
- Crawford J, Ianzano L, Savino M, Whitmore S, Cleton-Jansen AM, Settasatian C, d'apolito M, Seshadri R, Pronk JC, Auerbach AD, Verlander PC, Mathew CG, Tipping AJ, Doggett NA, Zelante L, Callen DF, Savoia A. The PISSLRE gene: structure, exon skipping, and exclusion as tumour suppressor in breast cancer. Genomics. 1999;56:90–97. doi: 10.1006/geno.1998.5676. - DOI - PubMed
MeSH terms
Substances
LinkOut - more resources
Full Text Sources
Other Literature Sources
Medical

