. 2004 Aug 16;166(4):493-505.
doi: 10.1083/jcb.200403109. Epub 2004 Aug 9.

Mouse centric and pericentric satellite repeats form distinct functional heterochromatin

Affiliations

Mouse centric and pericentric satellite repeats form distinct functional heterochromatin

Mounia Guenatri et al. J Cell Biol. .

Abstract

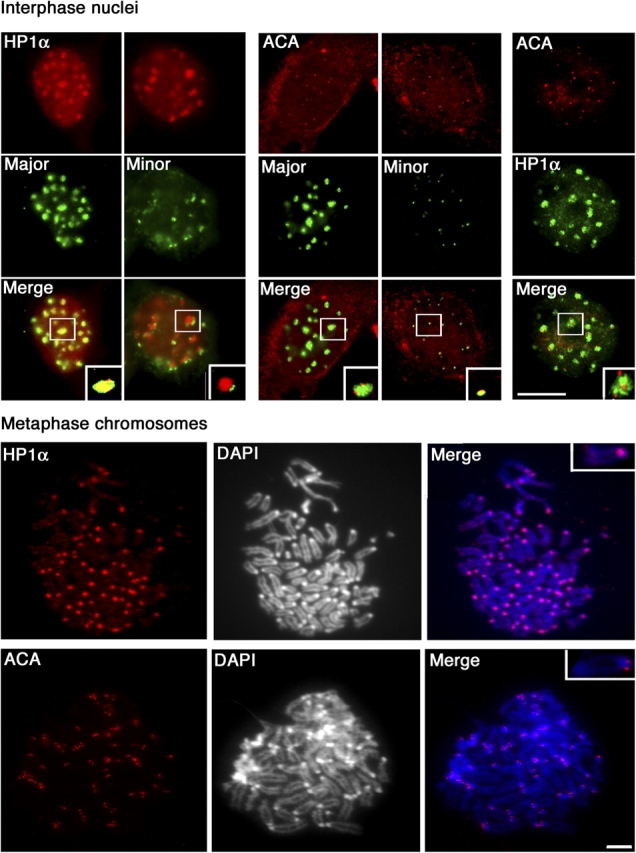
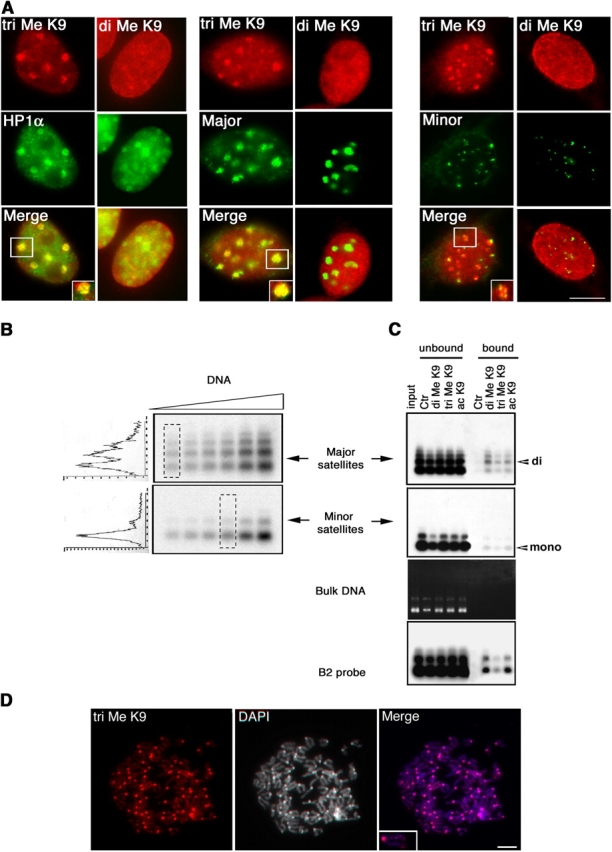
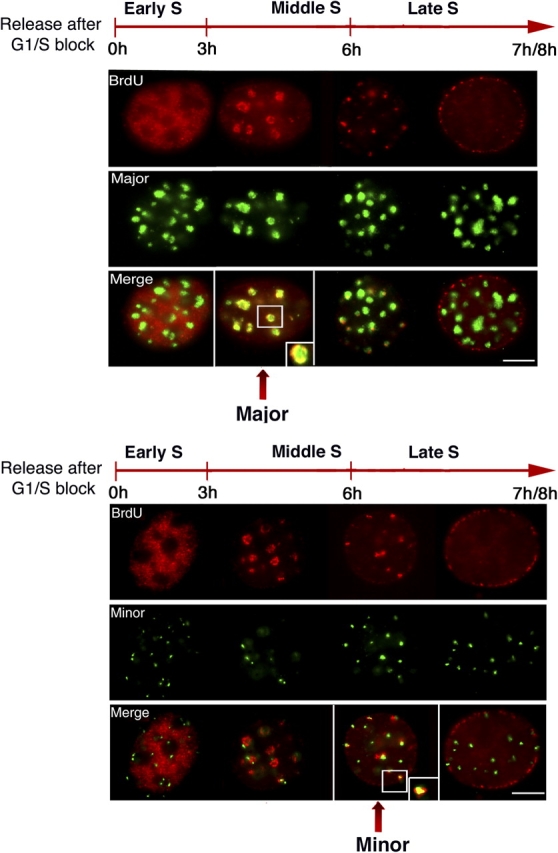
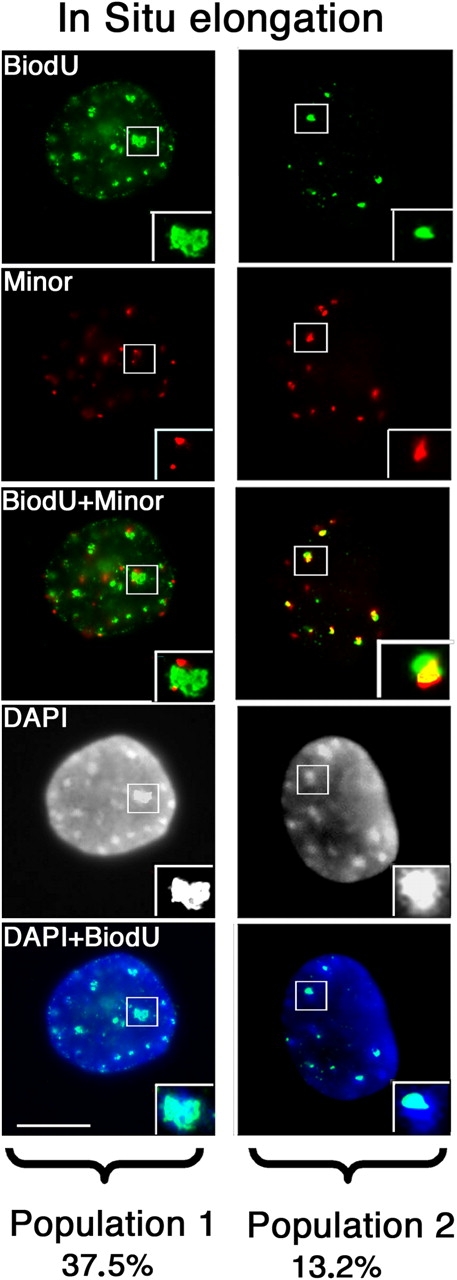
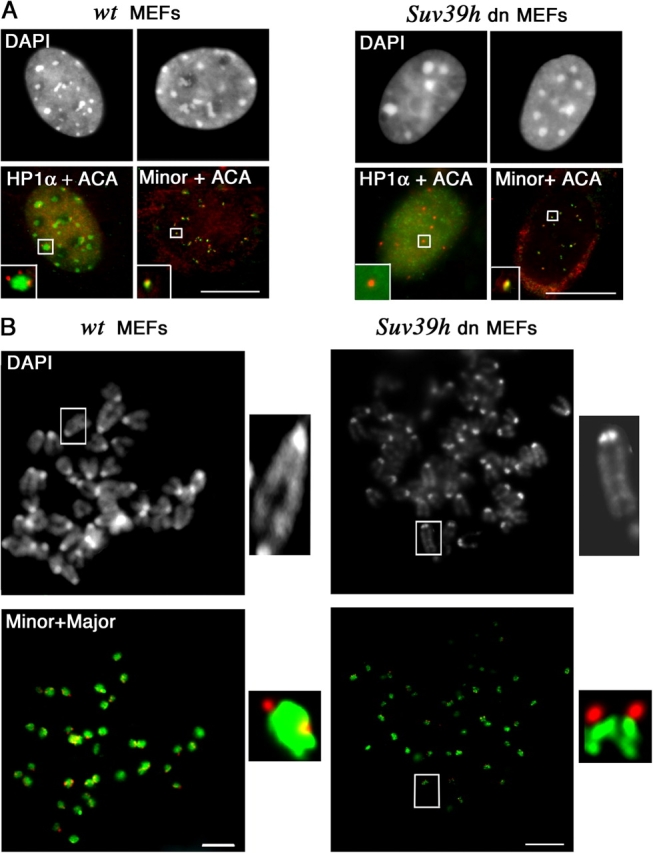
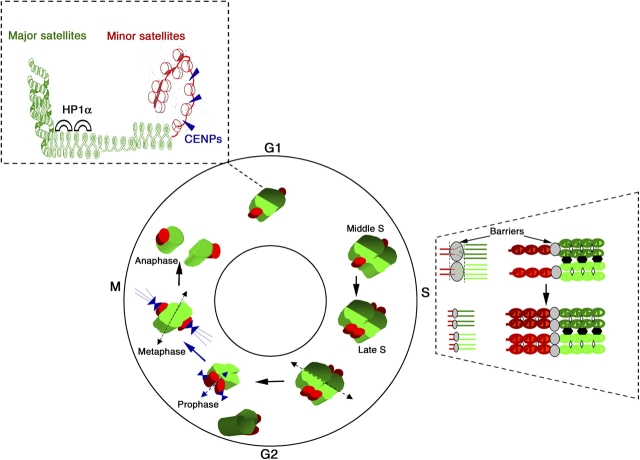
Heterochromatin is thought to play a critical role for centromeric function. However, the respective contributions of the distinct repetitive sequences found in these regions, such as minor and major satellites in the mouse, have remained largely unsolved. We show that these centric and pericentric repeats on the chromosomes have distinct heterochromatic characteristics in the nucleus. Major satellites from different chromosomes form clusters associated with heterochromatin protein 1alpha, whereas minor satellites are individual entities associated with centromeric proteins. Both regions contain methylated histone H3 (Me-K9 H3) but show different micrococcal nuclease sensitivities. A dinucleosome repeating unit is found specifically associated with major satellites. These domains replicate asynchronously, and chromatid cohesion is sustained for a longer time in major satellites compared with minor satellites. Such prolonged cohesion in major satellites is lost in the absence of Suv39h histone methyltransferases. Thus, we define functionally independent centromeric subdomains, which spatio-temporal isolation is proposed to be important for centromeric cohesion and dissociation during chromosome segregation.


Figures

Figure 1.
Figure 1.
Major and minor satellite DNA define three-dimensional domains in mouse interphase nuclei. (A, top) Scheme of a typical acrocentric mouse chromosome with the primary constriction corresponding to the centromeric region close to telomere. (a) The location of telomeres (black), major satellites (green), minor satellites (red), and the long arm of the chromosome (blue) are indicated. (b) A close-up view of the centromeric region is shown. (bottom) Localization of major and minor satellites on metaphase chromosomes by FISH analysis. (a–c) Minor satellite (red), major satellite (green) probes, and DNA (DAPI staining; blue) are shown. (d) Close-up view of the centromeric region. (B) Major and minor satellites in interphase. (a) Triple color image. (b) Two-color image of DAPI and minor satellites. (c) Two-color image of minor and major satellites. (d) A close-up view of the cluster. (C, top) Mid-zone confocal sections of an individual interphase nucleus showing major (green) and minor (red) satellites by two-color DNA FISH. Bars, 2 μm. (bottom) Three-dimensional reconstruction of the major (green) and minor (red) satellite DNA in mouse interphase nuclei. (top) Reconstructed model of a single nucleus. (middle) Close-up of a single cluster, around the Y-axis at 90° intervals from left to right.
Figure 2.
Figure 2.
Major and minor satellite organization during the cell cycle. (A) DNA FISH of major (green) and minor (red) satellite DNA on 3T3 cells throughout the cell cycle. DNA was visualized with DAPI. A close-up of selected foci or chromosome (insets, bottom panels). Bars, 5 μm. (B) Scheme for major and minor satellite dynamics of association during the cell cycle. Minor (small dots) and major (large dots) satellites from three individual chromosomes are presented in different color. A dark color is used for replicated chromatids. (1) Major satellites from different chromosomes associate in clusters in interphase. (2) Major satellites from different chromosomes dissociate in prophase. (3) Minor satellites from sister chromatids dissociate, whereas the major satellite sister chromatids still cohere. (4) Finally, during anaphase major satellite sister chromatids separate.
Figure 3.
Figure 3.
Major and minor satellite-specific marks in interphase and metaphase nuclei. Interphase: (left) HP1α (red) and major and minor DNA (green). (middle) ACA (CENP-A, B, C) is presented in red, major and minor DNA in green. (right) Costaining with ACA serum (red) combined with anti-HP1α antibodies (green). A close-up of selected foci (inset in the merged images). Metaphase: DNA was visualized with DAPI and protein staining in red. Double labeling is shown in merged images. A close-up of a chromosome selected (inset in the merged images). Bars, 5 μm.
Figure 4.
Figure 4.
Major and minor satellite domains differ in their higher chromatin organization. (A) Staining of interphase nuclei with di-Me-K9 and tri-Me-K9 antibodies (red), combined with either anti-HP1α (left, green) or FISH for major satellites (middle, green) or minor satellites (right, green). Insets correspond to close-ups of selected foci. (B) A range of concentration corresponding to native oligonucleosomes isolated by partial Mnase digestion were analyzed by gel electrophoresis followed by transfert and hybridization with indicated probes. Scans are presented for signals of comparable intensity as indicated. (C) NChIP with antibodies against di- and tri-Me-K9 H3. Autoradiographs of the membrane after hybridization are presented using labeled probes: mouse major satellite (top) or minor satellite (below) or B2 repeat (bottom), and ethidium bromide-stained gel (Bulk DNA) to show migration of bulk DNA in the nucleosome preparation. Positions of mononucleosomal (mono) and dinucleosomal (di) DNA are indicated. (D) Immunofluorescence on metaphase with tri-Me-K9 antibodies (red), DNA visualized with DAPI, and a close-up of a selected chromosome are shown (inset). Bars, 5 μm.
Figure 5.
Figure 5.
Replication timing of major and minor satellites during S-phase. Synchronized NIH 3T3 cells into S-phase were pulse labeled with BrdU for 10 min at the indicated times after release and stained for incorporation (BrdU, red) combined with DNA FISH (green) either for major (top) or minor satellites (bottom). Colocalization of BrdU staining with major or minor satellite DNA is presented in merged images. A close-up of a selected chromosome is shown (inset). Bars, 5 μm.
Figure 6.
Figure 6.
Major and minor satellites replication using in situ elongation with BiodU and minor satellite DNA FISH. Sites of DNA synthesis were labeled on MEFs by in situ elongation in the presence of Bio-16-dUTP for 90 min (green), followed by DNA FISH of minor satellites (red). Population 1, nuclei showing a complete staining of the DAPI dense clusters with BiodU. Population 2, nuclei showing a colocalization between BiodU and minor satellites DNA. Bar, 5 μm.
Figure 7.
Figure 7.
Major and minor satellite domains in Suv39h double mutant cells. (A) Major and minor satellite chromatin in MEFs Suv39h double mutant (Suv39h dn) compared with wild-type (wt) nuclei. Costaining with ACA serum (red) and anti-HP1α antibodies (green). ACA immunostaining (red) combined with minor satellite FISH (green). DNA was visualized with DAPI. Insets correspond to close-ups of selected foci. Bars, 5 μm. (B) Sister chromatid separation of minor and major satellites at metaphase stage in MEFs Suv39h double mutant (Suv39h dn) compared with wild type (wt). DNA FISH for major (green) and minor (red) satellites. DNA was visualized with DAPI. A close-up of a selected chromosome is shown along each panel (insets). Bars, 2 μm.
Figure 8.
Figure 8.
Model for the spatio-temporal isolation of major and minor satellite domains in the nucleus. (top) Major satellites in green associated with HP1α (black semi-circle) form a stable 30-nm fiber with a dinucleosomal periodicity. Minor satellites (red), which are more accessible, are associated with CENPs (blue triangle). During the cell cycle, clusters of major satellites from two different chromosomes (dark and light green spots) with corresponding minor satellites surrounding them (red spots) are presented in G1. In S-phase, the major and minor satellites replicate asynchronously. The two distinct domains are depicted on the right for the major (green) and minor (red). Newly synthesized sister chromatids are held together by specific proteins (white diamond). The clustering of major satellites is maintained during replication (black bridges). In prophase, the clusters of major satellites from different chromosomes dissociate (dotted arrow). Sister chromatid cohesion of minor satellites is lost first (blue arrow) followed by the separation of major satellite sister chromatids as a last event during anaphase (black arrow).

References

    1. Ahmad, K., and S. Henikoff. 2001. Centromeres are specialized replication domains in heterochromatin. J. Cell Biol. 153:101–110. - PMC - PubMed
    1. Alcobia, I., R. Dilao, and L. Parreira. 2000. Spatial associations of centromeres in the nuclei of hematopoietic cells: evidence for cell-type-specific organizational patterns. Blood. 95:1608–1615. - PubMed
    1. Bernard, P., J.F. Maure, J.F. Partridge, S. Genier, J.P. Javerzat, and R.C. Allshire. 2001. Requirement of heterochromatin for cohesion at centromeres. Science. 294:2539–2542. - PubMed
    1. Blower, M.D., B.A. Sullivan, and G.H. Karpen. 2002. Conserved organization of centromeric chromatin in flies and humans. Dev. Cell. 2:319–330. - PMC - PubMed
    1. Boyle, A.L., S.G. Ballard, and D.C. Ward. 1990. Differential distribution of long and short interspersed element sequences in the mouse genome: chromosome karyotyping by fluorescence in situ hybridization. Proc. Natl. Acad. Sci. USA. 87:7757–7761. - PMC - PubMed

Publication types

MeSH terms