Comparative Study
. 2004 Aug 16;200(4):493-505.
doi: 10.1084/jem.20040643. Epub 2004 Aug 9.

CCR7 signals are essential for cortex-medulla migration of developing thymocytes

Affiliations
Comparative Study

CCR7 signals are essential for cortex-medulla migration of developing thymocytes

Tomoo Ueno et al. J Exp Med. .

Erratum in

  • J Exp Med. 2004 Oct 4;200(7):following 946

Abstract

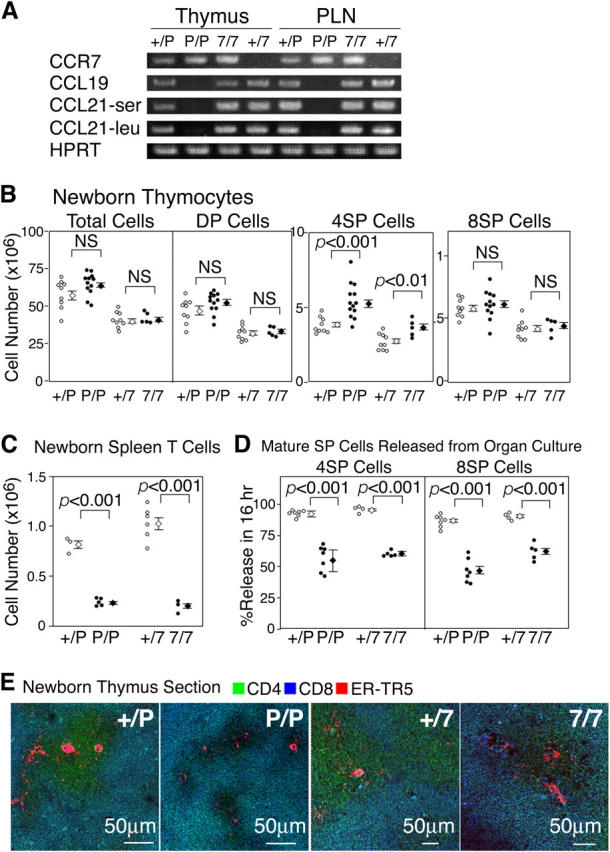
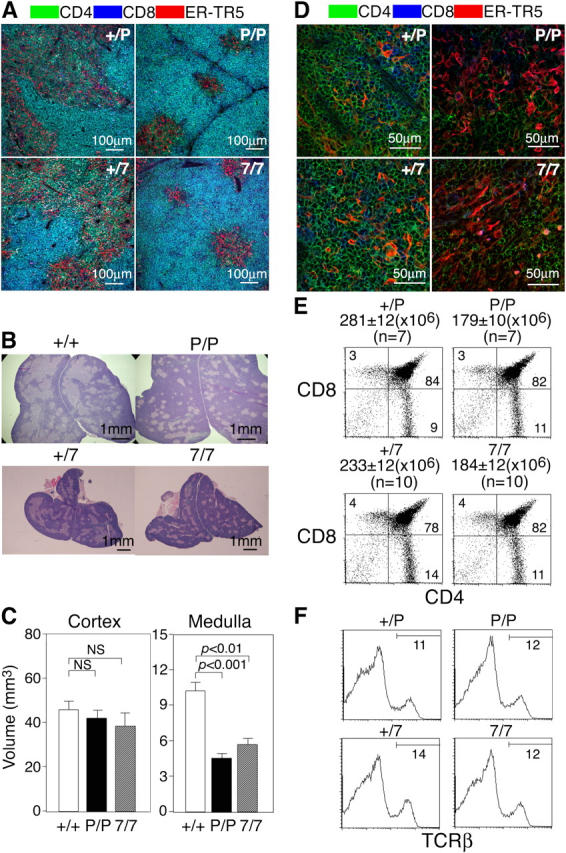
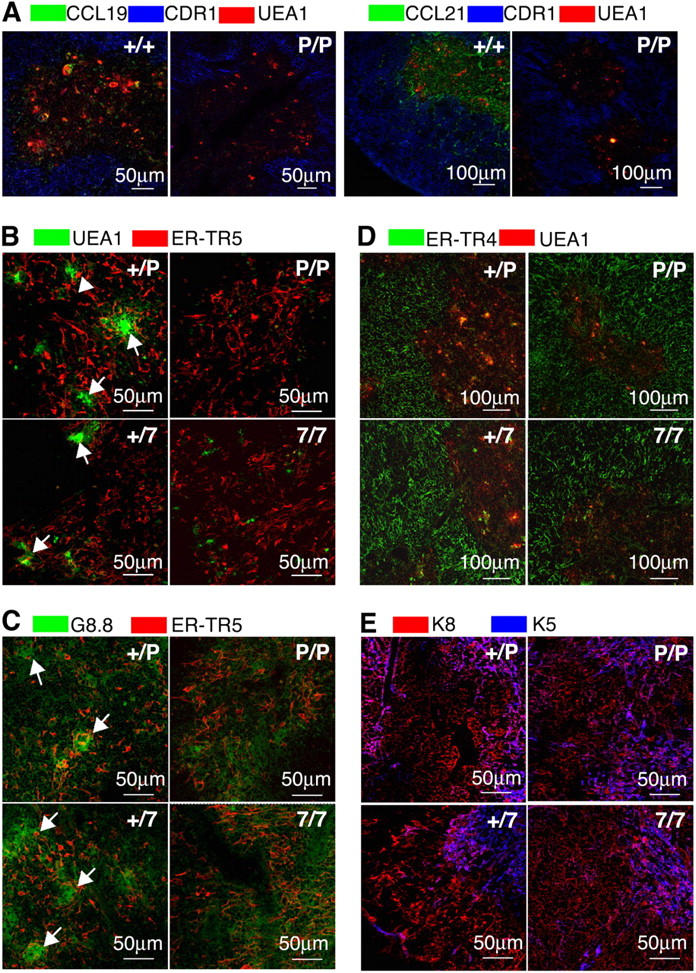
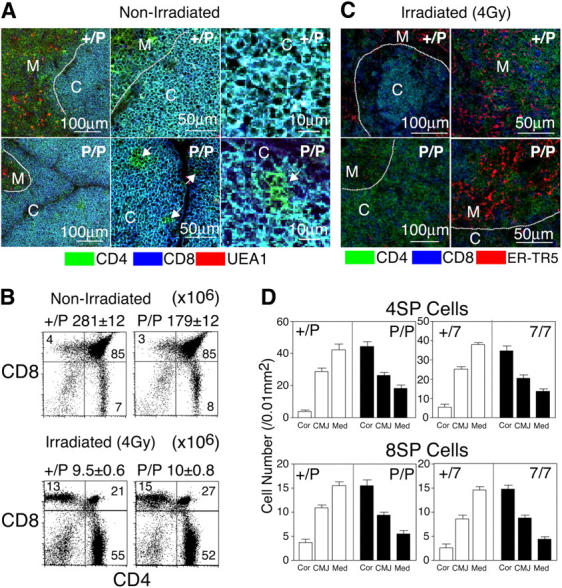
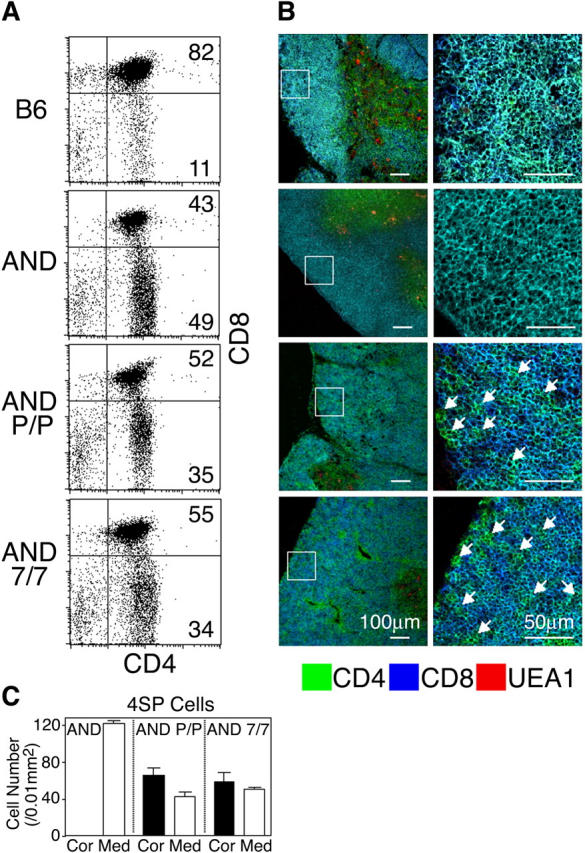
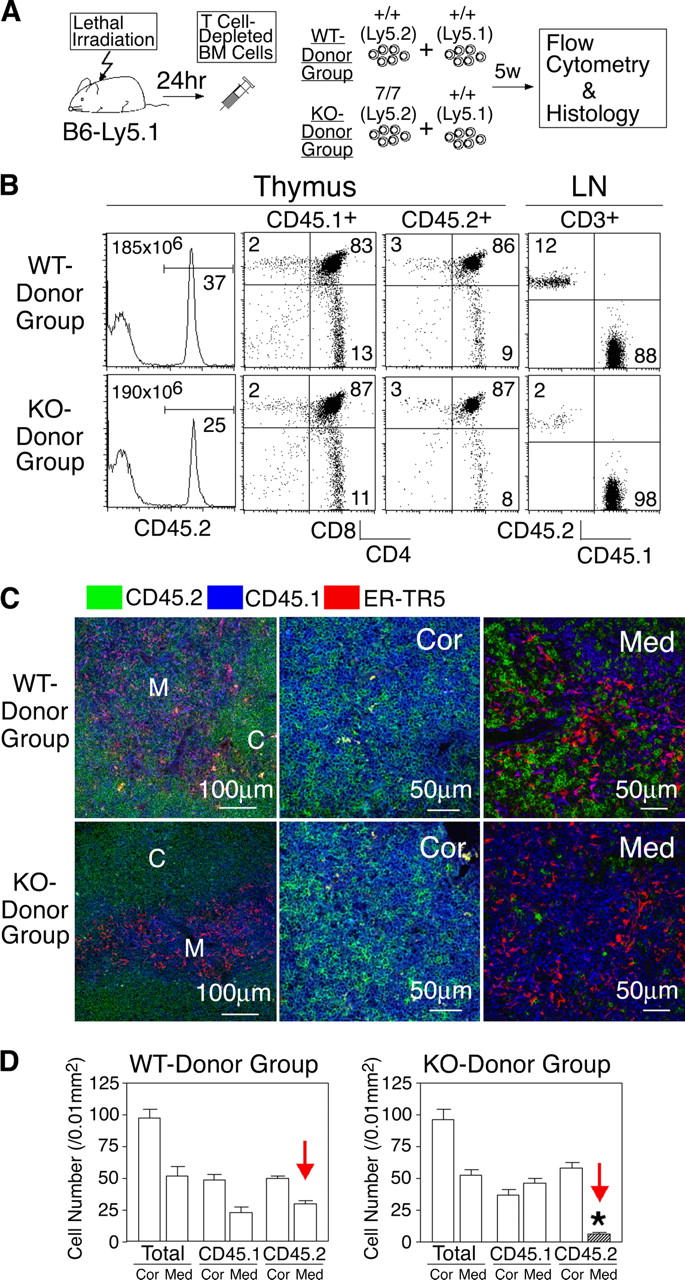
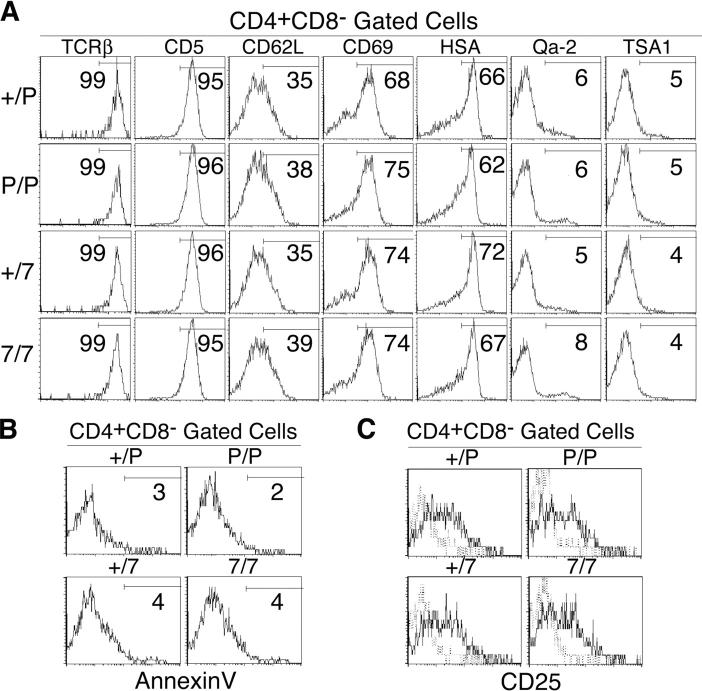
Upon TCR-mediated positive selection, developing thymocytes relocate within the thymus from the cortex to the medulla for further differentiation and selection. However, it is unknown how this cortex-medulla migration of thymocytes is controlled and how it controls T cell development. Here we show that in mice deficient for CCR7 or its ligands mature single-positive thymocytes are arrested in the cortex and do not accumulate in the medulla. These mutant mice are defective in forming the medullary region of the thymus. Thymic export of T cells in these mice is compromised during the neonatal period but not in adulthood. Thymocytes in these mice show no defects in maturation, survival, and negative selection to ubiquitous antigens. TCR engagement of immature cortical thymocytes elevates the cell surface expression of CCR7. These results indicate that CCR7 signals are essential for the migration of positively selected thymocytes from the cortex to the medulla. CCR7-dependent cortex-medulla migration of thymocytes plays a crucial role in medulla formation and neonatal T cell export but is not essential for maturation, survival, negative selection, and adult export of thymocytes.


Figures

Figure 1.
Figure 1.
Characterization of thymuses of newborn CCR7- or CCR7L-deficient mice. (A) RT-PCR analysis of lymphoid organs in CCR7- or CCR7L-deficient mice. Total cellular cDNA of thymuses and peripheral lymph nodes (PLN) was isolated from +/plt (+/P), plt/plt (P/P), CCR7+/− (+/7), and CCR7−/− (7/7) mice and was PCR amplified for CCR7, CCL19, CCL21-ser, CCL21-leu, and HPRT. (B) Thymocytes from indicated newborn mice at 5 d old were stained for CD4, CD8, and TCRβ and analyzed by flow cytometry. DP, 4SP, and 8SP represent CD4+CD8+, CD4+CD8TCRβhigh, and CD4CD8+TCRβhigh, respectively. Data from individual mice and means ± SE are indicated. (C) CD3highTCRβhigh T cells in the spleen were measured in 5-d-old mice. (D) Newborn mouse thymus lobes were cultured for 16 h, and cells within and outside the thymus lobes were stained for CD4 and CD8. Cells that were released from the thymus lobes were measured for CD4+CD8 and CD4CD8+ populations. (E) Three-color immunofluorescence analysis of newborn mouse thymus sections on the day of birth for CD4, CD8, and ER-TR5. Cells in cyan color (merging of green and blue) indicate CD4+CD8+ cells expressing both CD4 (in green) and CD8 (in blue). p values were calculated by the Student's t test. NS, not significant.
Figure 2.
Figure 2.
Characterization of thymuses of adult CCR7- or CCR7L-deficient mice. (A) Three-color immunofluorescence analysis for CD4 (green), CD8 (blue), and ER-TR5 (red). (B) Hematoxylin and eosin staining. (C) Three-dimensional analysis of the volumes (in cubic millimeters; means ± SEs) of cortical and medullary regions. (D) High magnification images of the immunofluorescence analysis for CD4, CD8, and ER-TR5. ER-TR5+ medullary regions are shown. (E and F) Flow cytometric analysis of thymocytes. Means ± SEs of total thymocytes (numbers of mice examined) are indicated. Numbers within each area indicate the frequency of cells within that area.
Figure 3.
Figure 3.
Thymic stromal cells in adult CCR7- or CCR7L-deficient mice. (A) Three-color immunofluorescence analysis for cortical epithelial cell specific CDR1 (blue), medullary epithelial cell specific UEA1 (red), and either CCL19 or CCL21 (green). (B) Medullary regions were stained for UEA1 (green) and ER-TR5 (red). (C) Medullary regions were stained for G8.8 (green) and ER-TR5 (red). (D) Staining for cortical epithelial cell–specific ER-TR4 (green) and medullary epithelial cell–specific UEA1 (red). (E) Staining for cortical epithelial cell–specific keratin-8 (red) and medullary epithelial cell–specific keratin-5 (blue). Arrows in B and C indicate clusters of highly condensed UEA1+ and G8.8+ cells in the medulla.
Figure 4.
Figure 4.
Distribution of SP thymocytes in the thymuses of sublethally irradiated adult CCR7- or CCR7L-deficient mice. (A and C) Three-color immunofluorescence analysis of the thymuses from nonirradiated (A) and 4 Gy–irradiated (C) mice. Dashed lines indicate junctions between the cortex and the medulla. C, cortex; M, medulla. Arrows in A indicate CD4+CD8 cells (in green) in the cortical region. (B) Flow cytometric analysis of thymocytes from nonirradiated and irradiated mice. Means ± SEs of total thymocytes are also indicated. (D) Means ± SEs of the numbers of CD4+CD8 (4SP) and CD4CD8+ (8SP) cells per unit area (0.01 mm2) of indicated regions of thymus sections are indicated. Cor, cortex; CMJ, cortico-medullary junction; Med, medulla.
Figure 5.
Figure 5.
Distribution of CD4 SP thymocytes in adult CCR7- or CCR7L-deficient AND-TCR transgenic mice. (A) Flow cytometric analysis of thymocytes from indicated mice. Numbers within each area indicate the frequency of cells within that area. (B) Three-color immunofluorescence analysis of the thymus sections for CD4, CD8, and UEA1. Higher magnification images of boxes in the left panels are shown on the right. Arrows indicate CD4+CD8 cells (in green) in the cortex. (C) Means ± SEs of the numbers of CD4+CD8 (4SP) cells per unit area (0.01 mm2) of indicated regions of thymus sections are indicated.
Figure 6.
Figure 6.
Intrathymic distribution of CCR7-deficient thymocytes in mixed bone marrow chimeras. (A) Scheme of the experimental protocol. (B) Flow cytometric analysis of thymocytes and lymph node (LN) cells. Where indicated, cells were gated for CD45.1+, CD45.2+, and CD3+ populations. Means of total thymocytes are also shown in histogram panels. (C) Three-color immunofluorescence analysis of thymus sections for CD45.2 (green), CD45.1 (blue), and ER-TR5 (red). (D) Means ± SEs of the numbers of total, CD45.1+, and CD45.2+ cells per unit area (0.01 mm2) of indicated regions of thymus sections are indicated. C and Cor, cortex; M and Med, medulla. *, P < 0.001.
Figure 7.
Figure 7.
Flow cytometric analysis of SP thymocytes in adult CCR7- or CCR7L-deficient mice. (A) Thymocytes from indicated mice were three-color stained for CD4, CD8, and indicated molecules. Shown are the profiles of CD4+CD8 cells. (B) Annexin V staining profiles of CD4+CD8 thymocytes from indicated mice. (C) Concanavalin A–stimulated thymocytes (solid lines) and control nonstimulated thymocytes (dashed lines) from indicated mice were stained for CD4, CD8, and CD25.
Figure 8.
Figure 8.
Selection and export of thymocytes in adult CCR7L- or CCR7-deficient mice, and CCR7 surface expression in thymocytes. (A) Thymocytes isolated from indicated mice were three-color stained for CD4, CD8, and transgenic TCR (T3.70 for HY-TCR and 1B2 for 2C-TCR). Shown are the dot plot profiles of transgenic TCR-expressing cells. Means ± SEs of total thymocytes are also indicated. (B and C) Thymocytes isolated from wild-type (wt) and plt/plt (plt) mice of C57BL/6 and BALB/c backgrounds were three-color stained for CD4, CD8, and indicated TCR-Vβs. Monoclonal antibodies specific for Cβ, Vβ3, Vβ4, Vβ5, Vβ6, and Vβ8 used were H57-597, KJ25, KT4, MR9-4, RR4-7, and F23.1, respectively. Shown are the frequencies of indicated Vβ+ cells within CD4SP (B) and CD8SP (C) populations. Means ± SEs of data from three individual mice are indicated. (D) Recent thymus emigrants within peripheral CD4+CD8 T cells were measured in adult mice at 24 and 48 h after the intrathymic FITC labeling. NS, not significant. (E) Thymocytes from adult B6 mice (top) or CCR7-deficient mice (bottom) were stained for CCL19-Ig. Dashed lines show control staining profiles. (F) CCL19-Ig staining profiles (solid lines) and control staining profiles (dashed lines) of indicated fractions of adult B6 thymocytes. (G) CCL19-Ig staining profiles (solid lines) and control staining profiles (dashed lines) of DP thymocytes from MHC-deficient mice. Thymocytes were cultured in suspension for indicated hours in the absence or presence of indicated reagents and were stained for CD4, CD8, and CCL19-Ig. (H) CCL19-Ig staining profiles of DP thymocytes from 2C-TCR transgenic mice of positively selecting H-2k/b background (kb, bold line) and null selecting H-2k/k background (kk, thin line). Dashed line indicates control staining profile.

Comment in

References

    1. van Ewijk, W. 1991. T-cell differentiation is influenced by thymic microenvironments. Annu. Rev. Immunol. 9:591–615. - PubMed
    1. Gill, J., M. Malin, J. Sutherland, D. Gray, G. Hollander, and R. Boyd. 2003. Thymic generation and regeneration. Immunol. Rev. 195:28–50. - PubMed
    1. Petrie, H.T. 2003. Cell migration and the control of post-natal T cell lymphopoiesis in the thymus. Nat. Rev. Immunol. 3:859–866. - PubMed
    1. Kim, C.H., L.M. Pelus, J.R. White, and H.E. Broxmeyer. 1998. Differential chemotactic behavior of developing T cells in response to thymic chemokines. Blood. 91:4434–4443. - PubMed
    1. Campbell, J.J., J. Pan, and E.C. Butcher. 1999. Developmental switches in chemokine responses during T cell maturation. J. Immunol. 163:2353–2357. - PubMed

Publication types