

Review
Alcoholism and the brain: an overview
Affiliations
- PMID: 15303622
- PMCID: PMC6668884
Item in Clipboard
Review
Alcoholism and the brain: an overview
Alcohol Res Health.
2003.
Abstract
Alcoholism can affect the brain and behavior in a variety of ways, and multiple factors can influence these effects. A person's susceptibility to alcoholism-related brain damage may be associated with his or her age, gender, drinking history, and nutrition, as well as with the vulnerability of specific brain regions. Investigators use a variety of methods to study alcoholism-related brain damage, including examining brains of deceased patients as well as neuroimaging, a technique that enables researchers to test and observe the living brain and to evaluate structural damage in the brain.
Figures
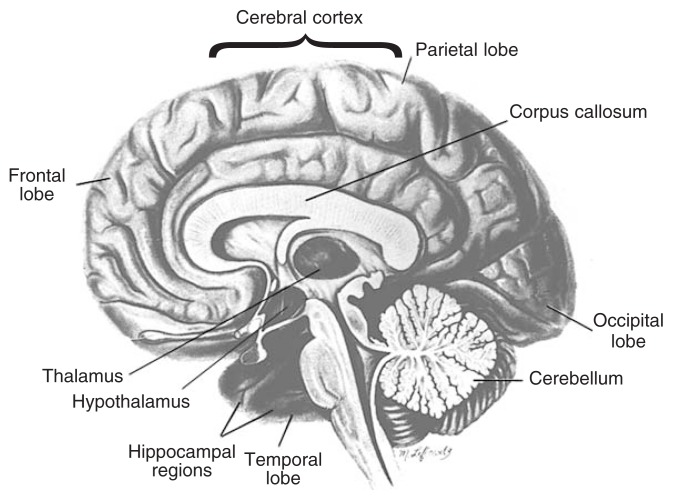
Schematic drawing of the human brain, showing regions vulnerable to alcoholism-related abnormalities.
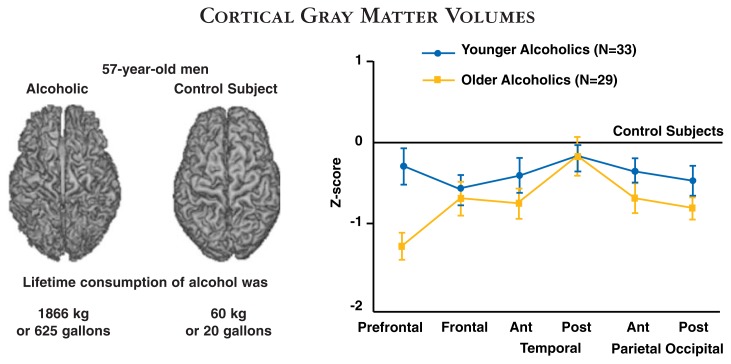
Brain MRI scans of age-equivalent men with different histories of alcohol use. The image shows clear evidence of brain shrinkage in the alcoholic compared with the control subject. The graph on the right shows that older alcoholics have less cortical tissue than younger alcoholics, and that the prefrontal cortex is especially vulnerable to alcohol’s effects. The location of the temporal, parietal, and occipital regions of the brain can be seen in figure 1. *Z-score is a mathematical measure that is useful for showing the difference between the recorded value and a “normal” value. SOURCE: Pfefferbaum et al. 1997.
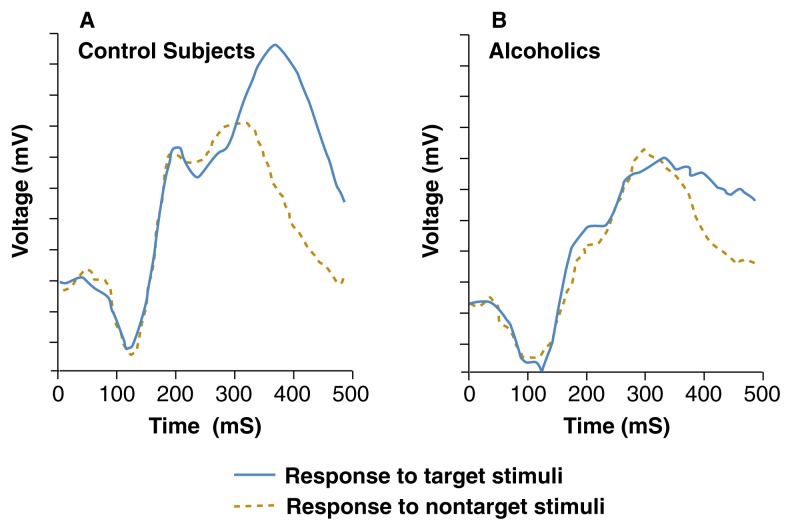
Brain electrical activity measured as event-related potentials (ERPs) in response to target stimuli (which require the subject to respond in some way) and nontarget stimuli (to be ignored by the subject). The brains of alcoholics are less responsive than the brains of nonalcoholic control subjects. The heights of the peaks are measured in terms of the strength of the electrical signal (volts) recorded from the scalp over time (in thousandths of a second, or mS). SOURCE: Porjesz and Begleiter 1995.
References
-
- Adams KM, Gilman S, Johnson-Greene D, et al. Significance of family history status in relation to neuropsychological test performance and cerebral glucose metabolism studied with positron emission tomography in older alcoholic patients. Alcoholism: Clinical and Experimental Research. 1998;22(1):105–110. - PubMed
-
- American Psychiatric Association (APA) Diagnostic and Statistical Manual of Mental Disorders. Fourth Edition. Washington, DC: APA; 1994.
-
- Bates ME, Bowden SC, Barry D. Neurocognitive impairment associated with alcohol use disorders: Implications for treatment. Experimental and Clinical Psychopharmacology. 2002;10(3):193–212. - PubMed
-
- Berglund M. Cerebral blood flow in chronic alcoholics. Alcoholism: Clinical and Experimental Research. 1981;5:295–303. - PubMed
-
- Cala LA, Mastaglia FL. Computerized tomography in chronic alcoholics. Alcoholism: Clinical and Experimental Research. 1981;5(2):283–294. - PubMed
Publication types
MeSH terms
Grants and funding
LinkOut - more resources
Full Text Sources
Medical