

Review
doi: 10.1021/cr0304121.
Structure determination of membrane proteins by NMR spectroscopy
Affiliations
- PMID: 15303829
- PMCID: PMC3270942
- DOI: 10.1021/cr0304121
Item in Clipboard
Review
Structure determination of membrane proteins by NMR spectroscopy
Chem Rev.
2004 Aug.
No abstract available
Figures
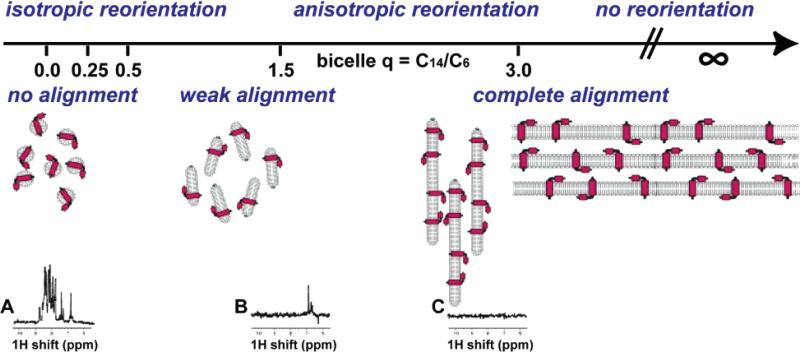
Linking of correlation times and alignments of the proteins in the samples. From left to right are isotropic reorientation to immobile, and no alignment to complete alignment. The samples are described by the q ratio for bicelles, ranging from 0 for isotropic micelles to 3 for large bicelles to infinity for bilayers, as illustrated schematically. Spectra A–C are one-dimensional 1H NMR spectra of a membrane protein in various samples: (A) q = 0 (isotropic micelle); (B) q = 0.5 (medium sized bicelle); (C) q = 3.0 (large bicelle).
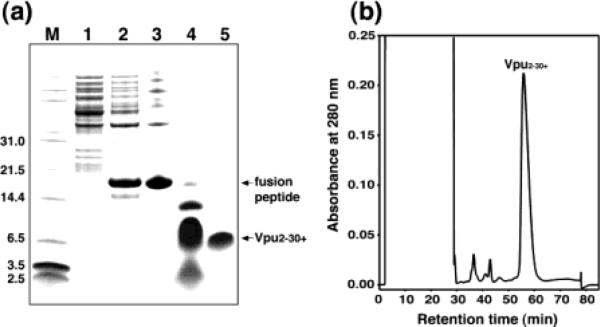
(A) SDS-PAGE analysis of the purification procedure for hydrophobic membrane proteins: lane 1, discarded soluble fractions; lane 2, inclusion bodies of the KSI–Vpu fusion peptide; lane 3, fusion peptide purified from Ni chelate chromatography; lane 4, mixture after CNBr cleavage; lane 5, purified polypeptide. (B) Reverse-phase HPLC purification of the polypeptide.
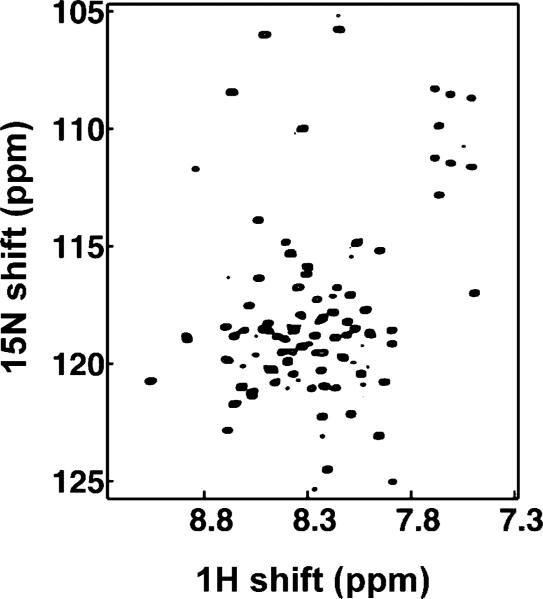
Two-dimensional HSQC spectrum of uniformly 15N labeled Vpu in micelles.
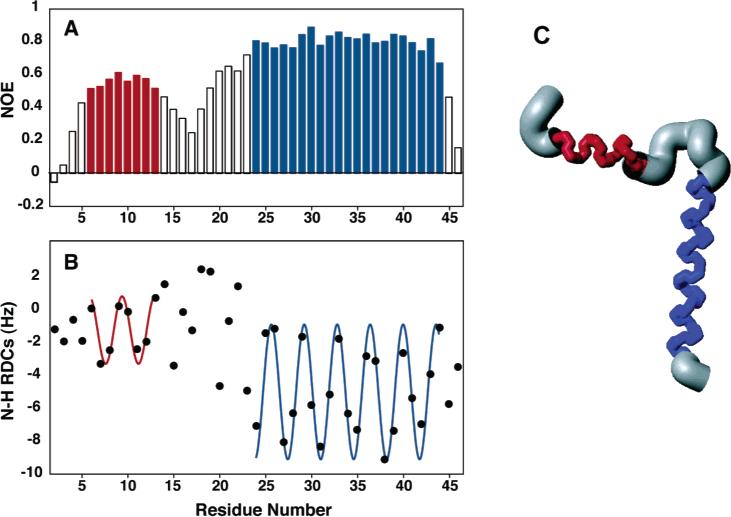
Structure and dynamics of Pf1 coat protein in micelles: (A) heteronuclear 1H–15N NOE as a function of residue number; (B) RDC as a function of residue number; (C) structure of the membrane-bound form of Pf1 coat protein.
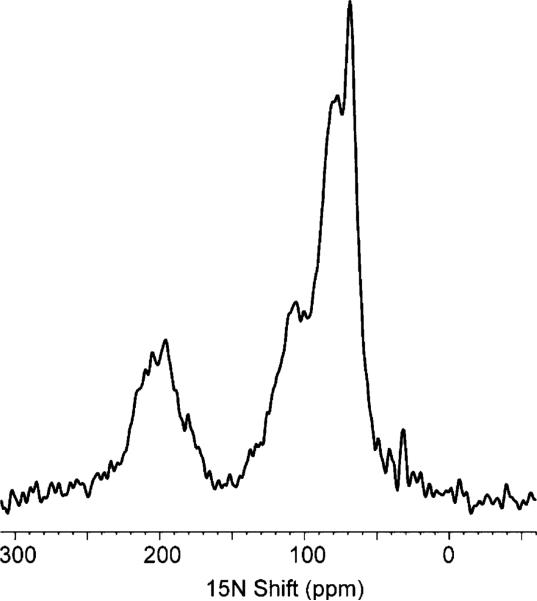
One-dimensional 15N NMR spectrum of uniformly 15N labeled Vpu in bilayers aligned between glass plates.
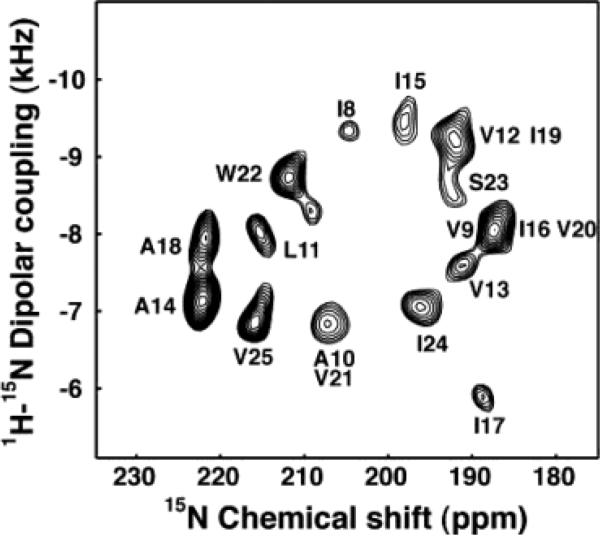
Experimental PISEMA spectrum of uniformly 15N labeled trans-membrane ion-channel domain of Vpu in bilayers aligned on glass plates.
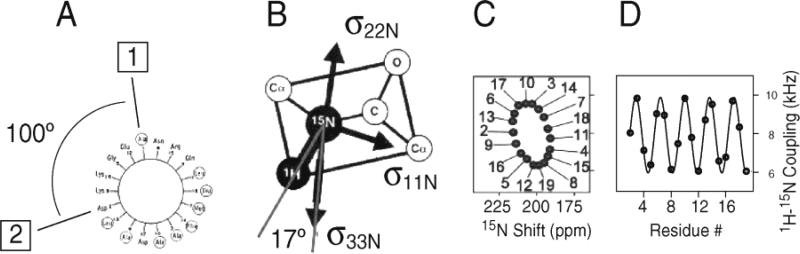
Principles of PISA wheels. (A) Helical wheel showing the 100° arc between adjacent residues that is a consequence of the periodicity of 3.6 residues per turn in an α-helix. (B) Orientations of the principal elements of the spin interaction tensors associated with 15N in a peptide bond. σ11, σ22, and σ33 are the principal elements of the 15N chemical shift interaction tensor, and the 1H–15N dipolar coupling interaction is along the NH bond. σ33 is in the peptide plane and makes an angle of 17° with the NH bond. (C) PISA wheel for an ideal α-helix. (D) Dipolar wave for an ideal α-helix.
(A) Ideal α-helix tilted at 0°, 30°, 60°, and 90° relative to the direction of the applied magnetic field. (B) PISA wheels corresponding to the various tilt angles. (C) Dipolar waves derived from the corresponding PISA wheels. (D) Dipolar waves for a weakly aligned sample.
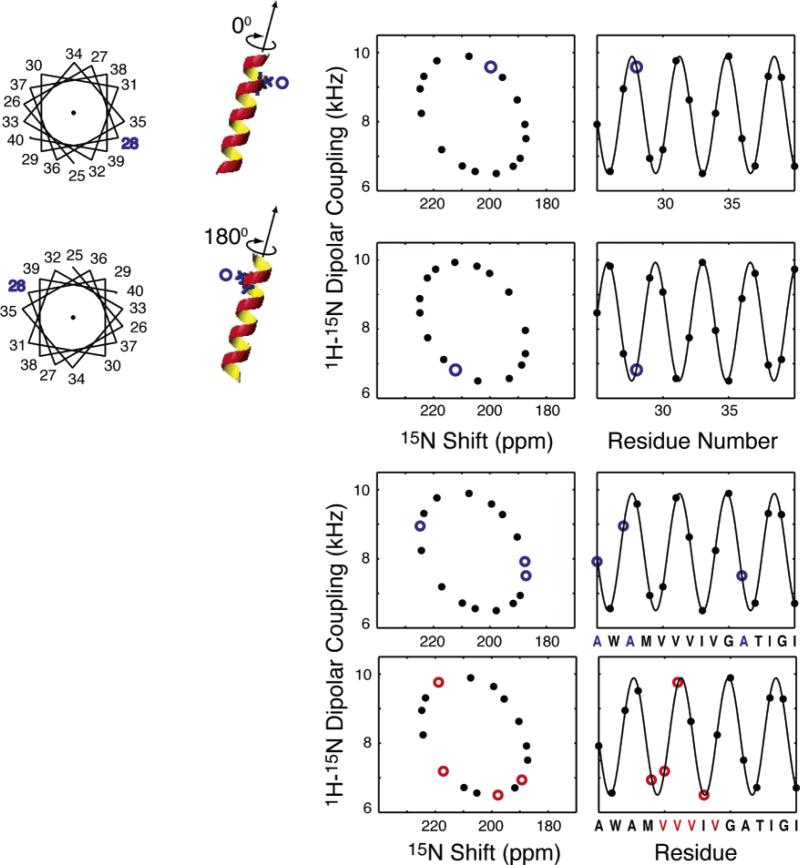
For an ideal α-helix tilted at 20° relative to the magnetic field, the position of a resonance from a particular residue in the wheel-like pattern is determined by its absolute rotation relative to the long axis of the helix. When a type of residue is present in multiple locations, the pattern of resonances is also uniquely a function of the rotation of the helix. Simulations are shown for a hypothetical Ala selective label and a Val selective label in the amino acid sequence shown on the bottom of the plots for the same helix.
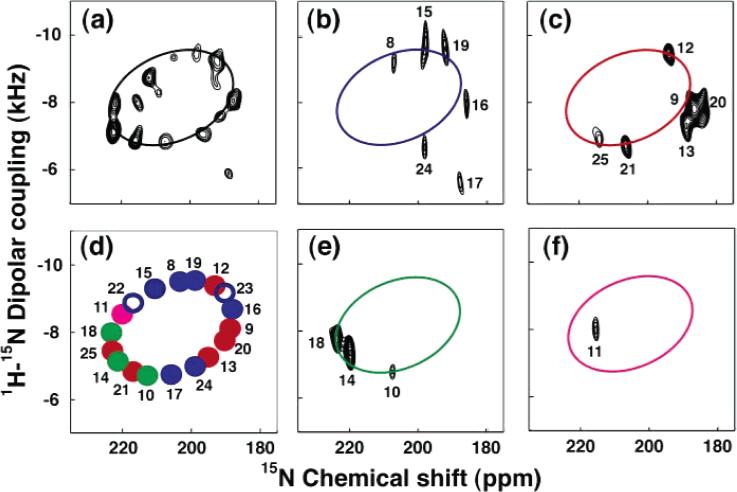
PISA wheel analysis of the PISEMA spectrum of Vpu: (a) uniformly 15N labeled; (b) 15N Ile (blue); (c) 15N Val (red); (d) simulated ideal PISA wheel with resonances corresponding to the Ile (blue), Val (red), Ala (green), and Leu (magenta); (e) 15N Ala (green); (f) 15N Leu (magenta).
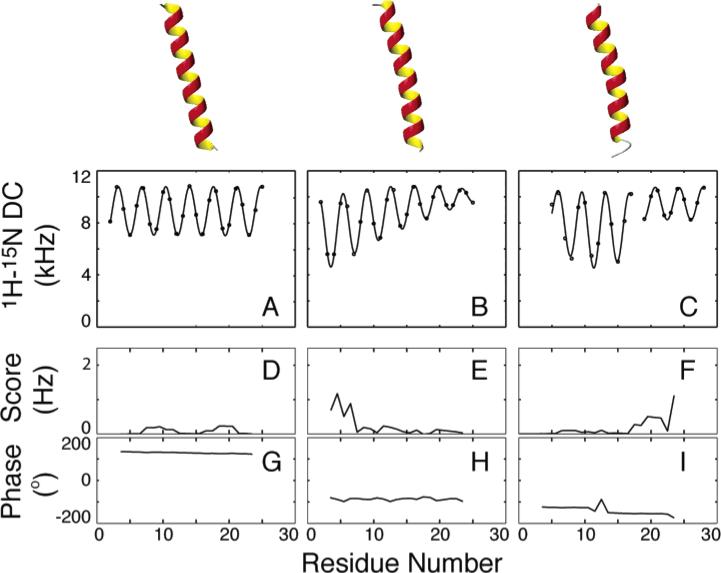
1H–15N dipolar couplings simulated for (A) a straight ideal α-helix, (B) an α-helix with a 55 Å radius of curvature, and (C) an ideal α-helix with a 20° kink with their average axis tilted 15° relative to the alignment z-axis. (D–F) The average error per point shows that the periodicity in all cases is 3.6 except near the ends, where there is some deviation. (G–I) The phase is also diagnostic, where the kink is evidenced by a slight change in the phase of one sinusoid relative to the other.
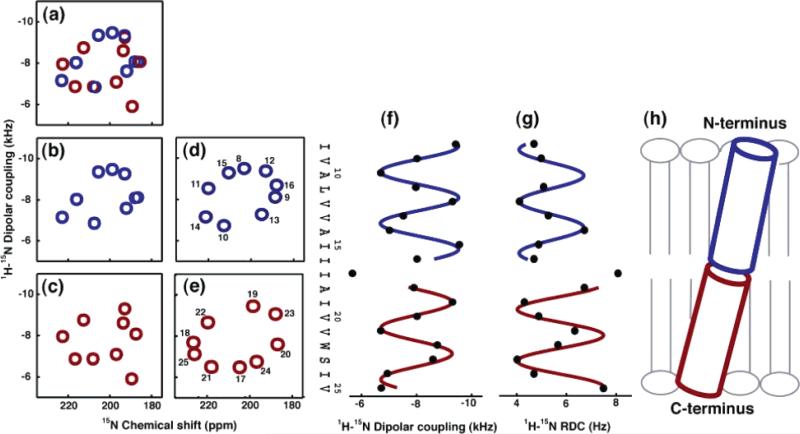
(a–c) Representations of the experimental PISEMA spectrum of Vpu2–30+ in completely aligned bilayers: (a) residues 8–25; (b) residues 8–16; (c) residues 17–25. (d and e) Ideal PISA wheels with uniform dihedral angles (ϕ ) –57°; ψ ) –47°) corresponding to the experimental data: (d) residues 8–16 with the tilt angle 12°; (e) residues 17–25 with the tilt angle 15°. (f) Dipolar waves of 1H–15N unaveraged dipolar couplings obtained from completely aligned bilayers. (g) Dipolar waves of 1H–15N residual dipolar couplings obtained from weakly aligned micelles. (h) A tube representation of the trans-membrane helix of Vpu in lipid bilayers.
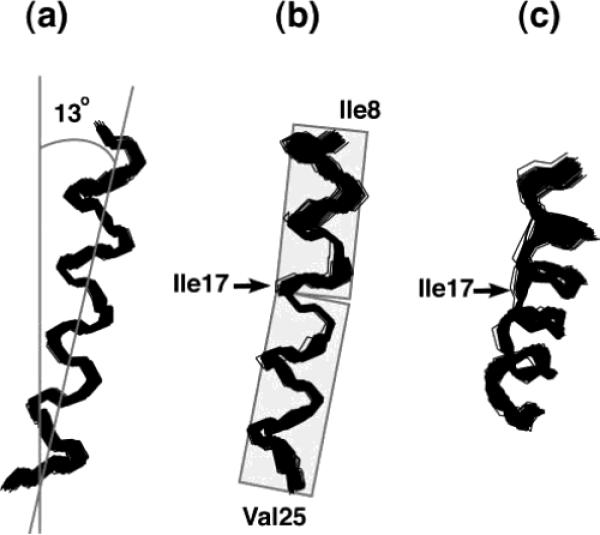
(a) Superimposition of 100 calculated backbone structures of the trans-membrane helix of Vpu. (b) A 90° rotation of panel part a to the vertical axis. (c) A 30° tilt of panel part b toward the reader. The structures were obtained by structural fitting of the experimental solid-state NMR data and are aligned for the best overlap of residues Ile8–Val25. The average tilt of about 13° relative to the membrane normal and a slight kink near residue Ile17 are apparent when it is noted that the plane of the average tilt of the helix does not coincide with the plane of the kink.
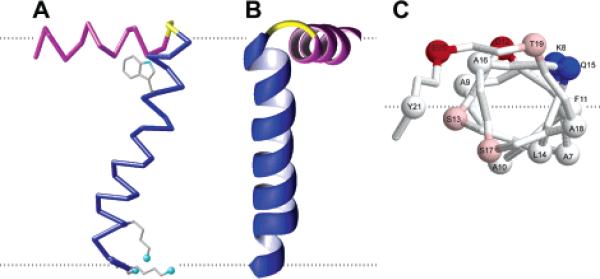
Structure of the membrane-bound form of the fd coat protein in lipid bilayers with the in-plane helix in magenta, the trans-membrane helix in blue, and the short connecting turn in yellow. The flexible N- and C-termini are not shown. (A) Side view showing the 26° tilt of the TM helix. The dashed gray lines mark the lipid bilayer membrane boundary. The direction of the applied magnetic field is parallel to the arrow. (B) Front view. (C) N-terminal view of the in-plane helix Cα atoms. The dashed gray line marks the boundary between hydrophilic and hydrophobic (gray) residues.
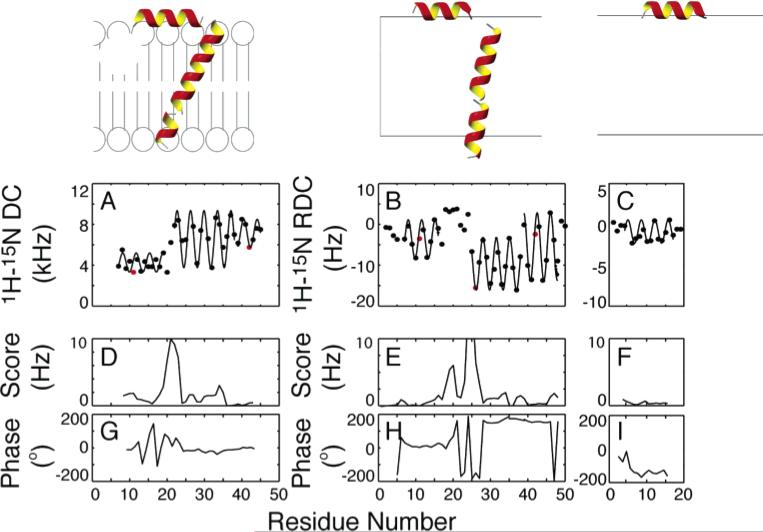
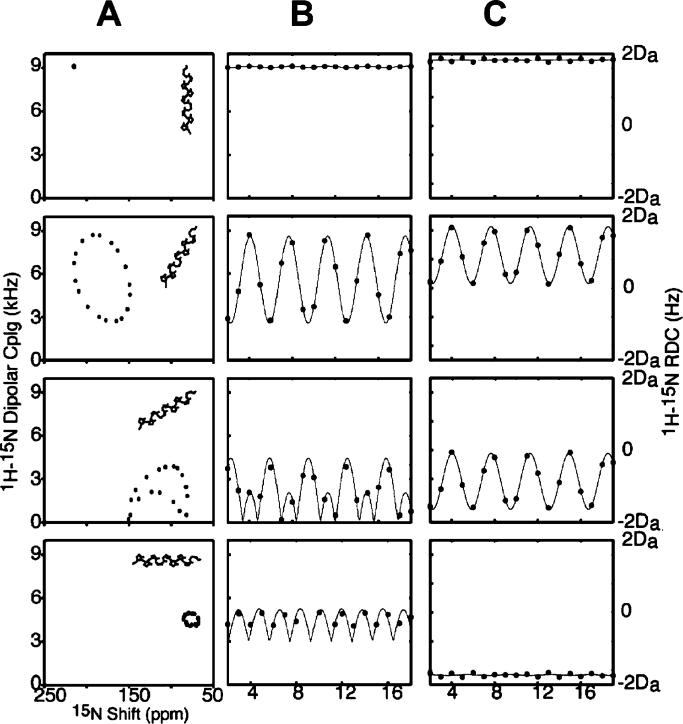
Experimentally measured dipolar couplings are shown for (A) fd coat protein in completely aligned bilayers, (B) fd coat protein in weakly aligned micelles, and (C) fdN (N-terminal 20 residues) in weakly aligned micelles. All datasets are shown with the best-fitting sinusoid and the parametrized expression yielding the tilts and rotations of the helices in the alignment frame. Shown below each dataset is (D–F) the rmsd to an ideal sinusoid and (G–I) the absolute phase of that sinusoid for each point. The positions of residues Phe11, Trp26, and Phe42 are highlighted in red (A, B, C) to characterize the rotations of the helices in the context of dipolar waves.
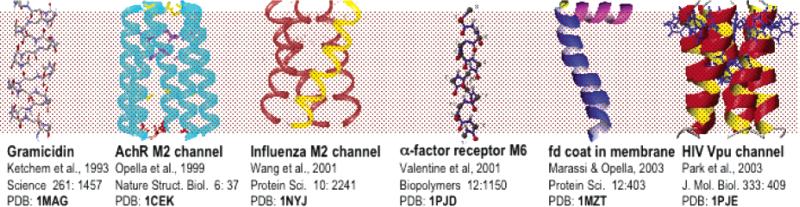
Structures determined by solid-state NMR in oriented bilayers. The PDB file numbers are in bold face.
References
-
- Berman H, Henrick K, Nakamura H. Nature Struct. Biol. 2003;10:980. - PubMed
-
- Torres J, Stevens TJ, Samso M. Trends Biochem. Sci. 2003;28:137. - PubMed
-
- White SH, Wimley WC. Annu. Rev. Biophys. Biomol. Struct. 1999;28:319. - PubMed
-
- Fraser CM, Gocayne JD, White O, Adams MD, Clayton RA, Fleischmann RD, Bult CJ, Kerlavage AR, Sutton G, Kelley JM, et al. Science. 1995;270:397. - PubMed
-
- Opella SJ. Nature Struct. Biol. 1997;4(Suppl.):845. - PubMed
Publication types
MeSH terms
Substances
Grants and funding
LinkOut - more resources
Full Text Sources
Other Literature Sources
