

DNA and its counterions: a molecular dynamics study
- PMID: 15304564
- PMCID: PMC514386
- DOI: 10.1093/nar/gkh765
DNA and its counterions: a molecular dynamics study
Abstract
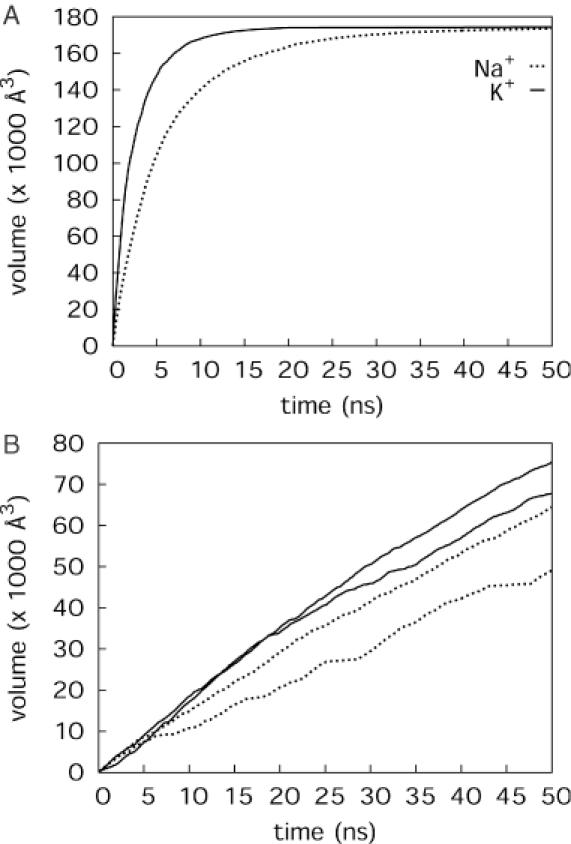
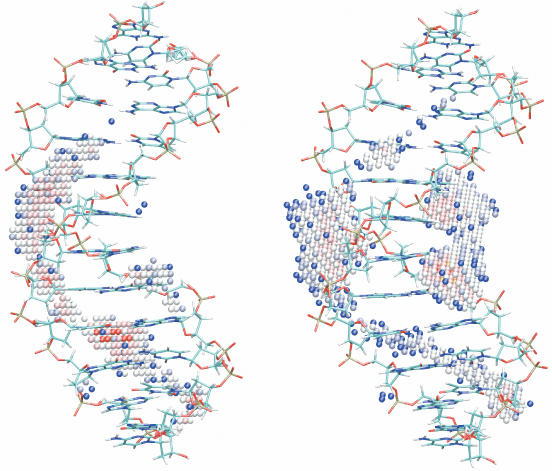
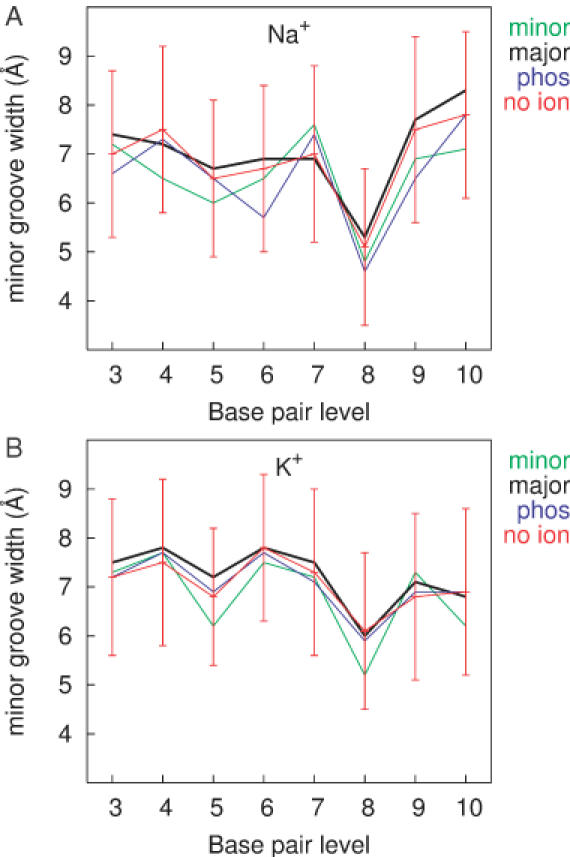
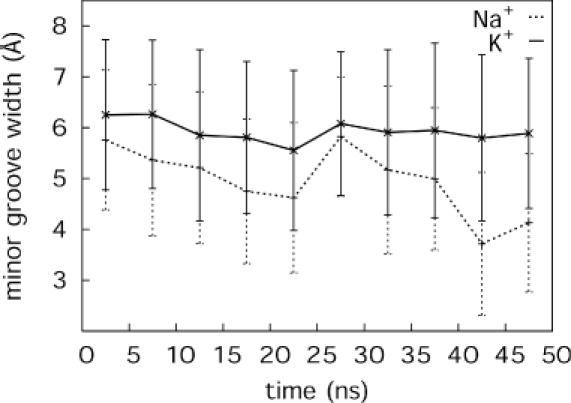
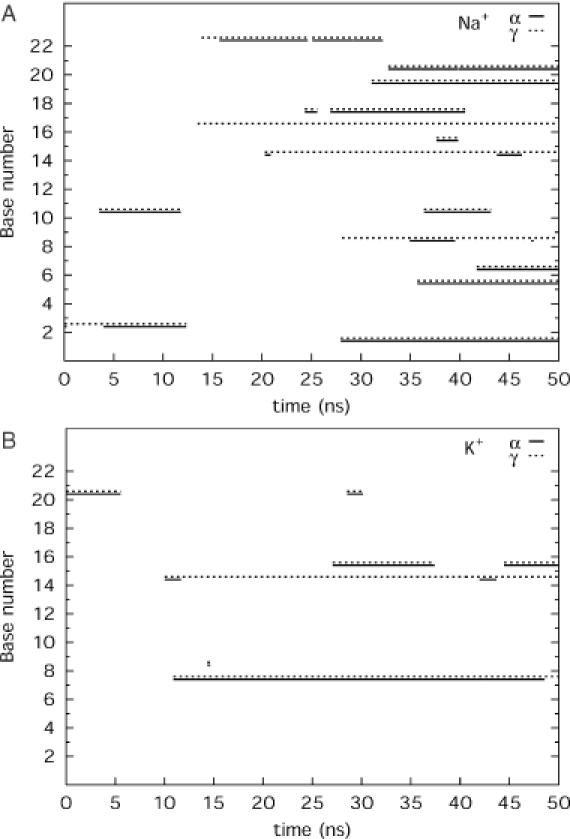
The behaviour of mobile counterions, Na+ and K+, was analysed around a B-DNA double helix with the sequence CCATGCGCTGAC in aqueous solution during two 50 ns long molecular dynamics trajectories. The movement of both monovalent ions remains diffusive in the presence of DNA. Ions sample the complete space available during the simulation time, although individual ions sample only about one-third of the simulation box. Ions preferentially sample electronegative sites around DNA, but direct binding to DNA bases remains a rather rare event, with highest site occupancy values of <13%. The location of direct binding sites depends greatly on the nature of the counterion. While Na+ binding in both grooves is strongly sequence-dependent with the preferred binding site in the minor groove, K+ mainly visits the major groove and binds close to the centre of the oligomer. The electrostatic potential of an average DNA structure therefore cannot account for the ability of a site to bind a given cation; other factors must also play a role. An extensive analysis of the influence of counterions on DNA conformation showed no evidence of minor groove narrowing upon ion binding. A significant difference between the conformations of the double helix in the different simulations can be attributed to extensive alpha/gamma transitions in the phosphate backbone during the simulation with Na+. These transitions, with lifetimes over tens of nanoseconds, however, appear to be correlated with ion binding to phosphates. The ion-specific conformational properties of DNA, hitherto largely overlooked, may play an important role in DNA recognition and binding.
Figures

References
-
- Saenger W. (1984) Principles of Nucleic Acid Structure. Springer, NY.
-
- Dickerson R.E. and Drew,H.R. (1981) Structure of a B-DNA dodecamer: influence of base sequence on helix structure. J. Mol. Biol., 149, 761–786. - PubMed
-
- Nelson H.C., Finch,J.T., Luisi,B.F. and Klug,A. (1987) The structure of an oligo(dA)·oligo(dT) tract and its biological implications. Nature, 330, 221–226. - PubMed
-
- Drew H.R. and Dickerson,R.E. (1981) Structure of a B-DNA dodecamer. III. Geometry of hydration. J. Mol. Biol., 151, 535–556. - PubMed
-
- Kopka M.L., Fratini,A.V., Drew,H.R. and Dickerson,R.E. (1983) Ordered water structure around a B-DNA dodecamer. A quantitative study. J. Mol. Biol., 163, 129–146. - PubMed
Publication types
MeSH terms
Substances
LinkOut - more resources
Full Text Sources
Medical
Miscellaneous
