. 2004 Aug 17;101(33):12125-9.
doi: 10.1073/pnas.0401709101. Epub 2004 Aug 10.

High-resolution vegetation and climate change associated with Pliocene Australopithecus afarensis

Affiliations

High-resolution vegetation and climate change associated with Pliocene Australopithecus afarensis

R Bonnefille et al. Proc Natl Acad Sci U S A. .

Abstract

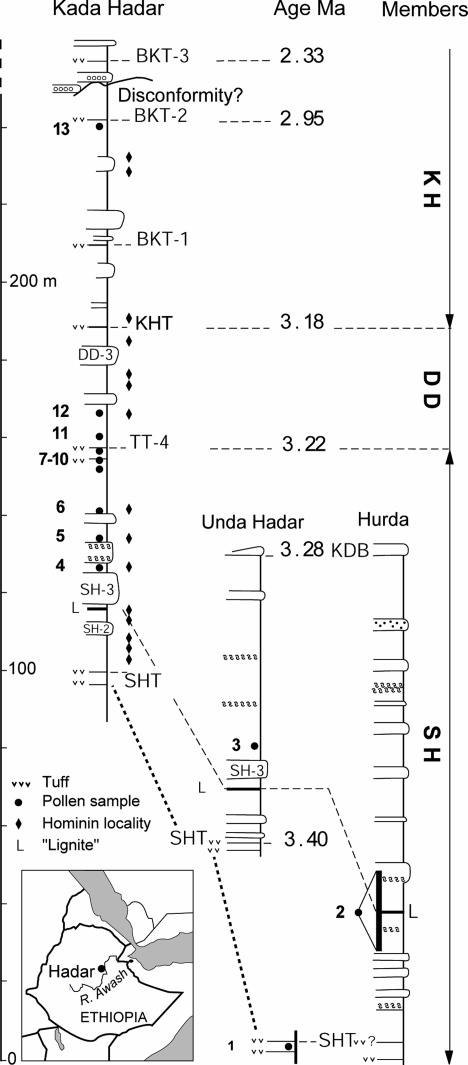
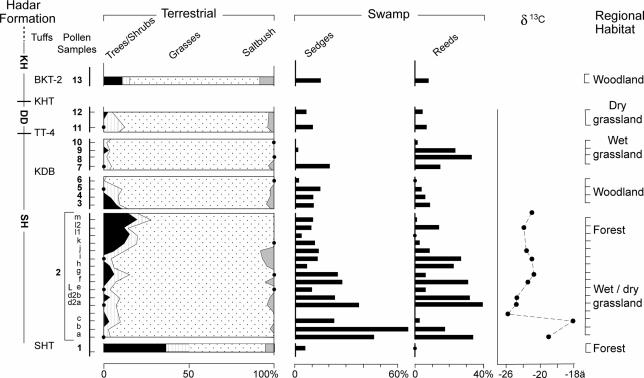
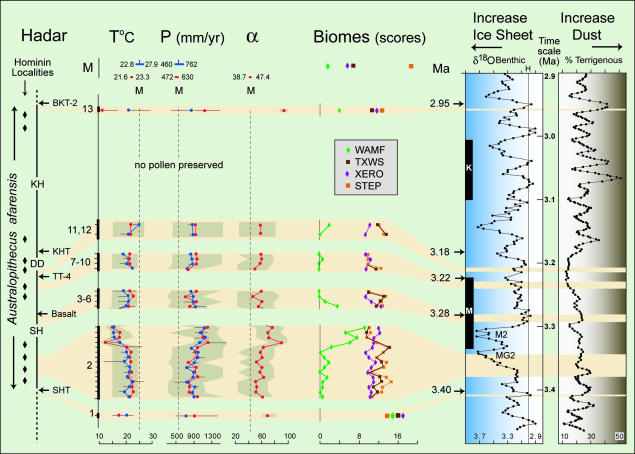
Plio-Pleistocene global climate change is believed to have had an important influence on local habitats and early human evolution in Africa. Responses of hominin lineages to climate change have been difficult to test, however, because this procedure requires well documented evidence for connections between global climate and hominin environment. Through high-resolution pollen data from Hadar, Ethiopia, we show that the hominin Australopithecus afarensis accommodated to substantial environmental variability between 3.4 and 2.9 million years ago. A large biome shift, up to 5 degrees C cooling, and a 200- to 300-mm/yr rainfall increase occurred just before 3.3 million years ago, which is consistent with a global marine delta(18)O isotopic shift.


Figures

Fig. 1.
Fig. 1.
Location of pollen samples (bold numbers) from the Hadar Formation, according to stratigraphy (–16), dated tuffs (12, 13), and hominin localities (–9). 1: clay, 20 cm below SHT, 3.40 mya; 2: lacustrine black clay (L), 20-m section ≈30 m above SHT and ≈80 m below the 3.28 mya KDB, 3.37–3.35 mya; 3: silty clay, 3 m above the top of the SH-3 sand and below the gastropod layer, <3.28 mya; 4: brown clay, 11 m above the base of the SH-3 sand, 3.25 mya; 5: silt, lower contact of pink calcareous marl, 3.25 mya; 6: green clay, below TT-4, 3.24 mya; 7: green clay, below TT-4, 3.23 mya; 8: sandy clay, below TT-4, 3.22 mya; 9: black clay, 50 cm below ostracod layer, 3.22 mya; 10: ostracod clay, below TT-4, 3.22 mya; 11: silt, 2m above TT-4, <3.22 mya; 12: clay, 10 m above TT-4, <3.18 mya; 13: clay, lower contact with BKT-2, 2.95 mya. All ages are interpolated except for samples 1 and 13. Although pollen sampling was systematically done throughout the section, including hominin localities, fossil pollen were preserved only in specific strata.
Fig. 2.
Fig. 2.
Summary pollen diagram of the Hadar Formation, showing pollen frequencies from trees/shrubs, grasses, and saltbush, calculated after excluding swamp component and fern spores. Stratigraphy as in Fig. 1. Interpretation of regional habitat is based on a classical palynological approach without statistical comparison. Stable δ13C values from total organic matter have been provided by T. E. Cerling (University of Utah, Salt Lake City).
Fig. 3.
Fig. 3.
Estimated climatic parameters and biome scores associated with Hadar geochronology (Left) and related to variations of global climate (δ18O) and dust recorded from the Indian Ocean (Right). T°C refers to mean annual temperature (Tann) estimated by the BA method (blue curve) and MTCO estimated by the PFT method (red curve). P (mm/yr) refers to mean annual precipitation estimated by the BA method (blue curve) and by the PFT method (red curve). Humidity coefficient (α) is reconstructed by the PFT method. (Upper) Modern references (M) for Hadar correspond to the range of estimated climatic parameters and biome scores obtained on modern pollen samples, showing the overlap between the two methods. The vertical dotted line corresponds to the mean of the modern estimates, which is compared against Pliocene values. Red and blue dots represent the highest probability estimates; statistical error (see text) is indicated in gray for the red dots and by a horizontal solid line for the blue dots. Biomes (see text) include WAMF, STEP, TXWS, and XERO. Terrigenous percent is from Ocean Drilling Program (ODP) sites 721/722 (2). δ18O benthic is from ODP site 846 (29).

References

    1. Vrba, E. S., Denton, G. H., Partridge, T. C. & Burckle, L. H., eds. (1995) Paleoclimate and Evolution, with Emphasis on Human Origins (Yale Univ. Press, New Haven, CT).
    1. deMenocal, P. B. (1995) Science 270, 53-59. - PubMed
    1. Potts, R. (1998) Yrb. Phys. Anthropol. 41, 93-136. - PubMed
    1. WoldeGabriel, G., White, T. D., Suwa, G., Renne, P., de Heinzelin, J., Hart, W. K. & Heiken, G. (1994) Nature 371, 330-333. - PubMed
    1. Behrensmeyer, A. K., Todd, N. E., Potts, R. & McBrinn, G. E. (1997) Science 278, 1589-1594. - PubMed

Publication types

LinkOut - more resources