. 2004 Sep;75(1):1-31.
doi: 10.1002/bip.20102.

Understanding the alpha-helix to coil transition in polypeptides using network rigidity: predicting heat and cold denaturation in mixed solvent conditions

Affiliations

Understanding the alpha-helix to coil transition in polypeptides using network rigidity: predicting heat and cold denaturation in mixed solvent conditions

Donald J Jacobs et al. Biopolymers. 2004 Sep.

Abstract

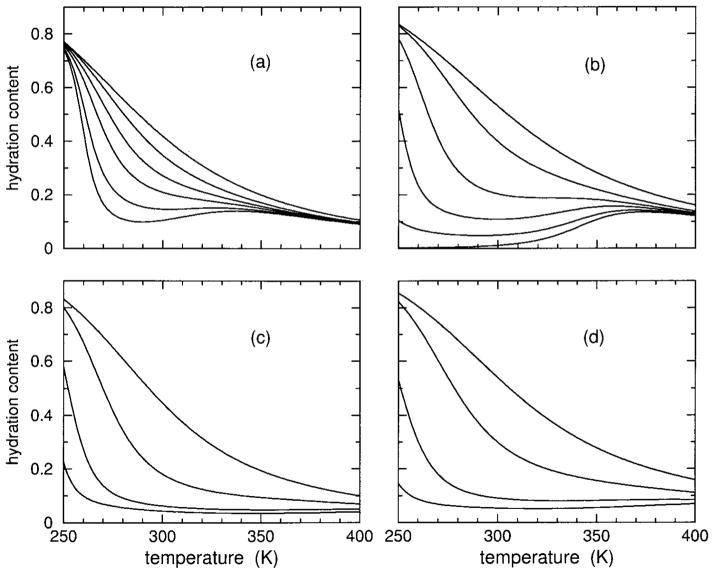
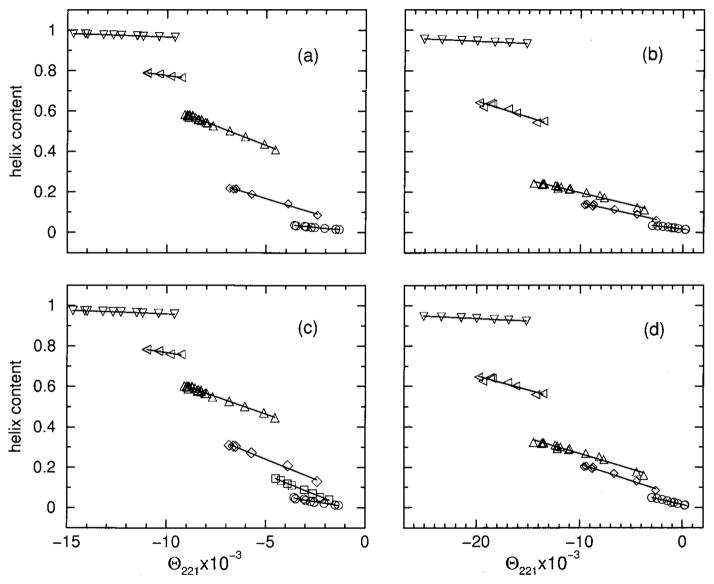
Thermodynamic stability in polypeptides is described using a novel Distance Constraint Model (DCM). Here, microscopic interactions are represented as constraints. A topological arrangement of constraints define a mechanical framework. Each constraint in the framework is associated with an enthalpic and entropic contribution. All accessible topological arrangements of distance constraints form an ensemble of mechanical frameworks, each representing a microstate of the polypeptide. A partition function is calculated exactly using a transfer matrix approach, where in many respects the DCM is similar to the Lifson-Roig model. The crucial difference is that the effect of network rigidity is explicitly calculated for each mechanical framework in the ensemble. Network rigidity is a mechanical interaction that provides a mechanism for long-range molecular cooperativity and enables a proper treatment of the nonadditivity of a microscopic free energy decomposition. Accounting for (1) helix <--> coil conformation changes along the backbone similar to the Lifson-Roig model, (2) i to i + 4 hydrogen-bond formation <--> breaking similar to the Zimm-Bragg model, and (3) structured <--> unstructured solvent interaction (hydration effects), a six-parameter DCM describes normal and inverted helix-coil transitions in polypeptides. Under suitable mixed solvent conditions heat and cold denaturation is predicted. Model parameters are fitted to experimental data showing different degrees of cold denaturation in monomeric polypeptides in aqueous hexafluoroisopropanol (HFIP) solution at various HFIP concentrations. By assuming a linear HFIP concentration dependence (up to 6% by mole fraction) on model parameters, all essential experimentally observed features are captured.


Figures

FIGURE 1
FIGURE 1
Best fits to experimental CD data for polypeptide sCT(8 –32). Calculated results from models I and II are (inversed) transformed and shown as dashed and solid lines, respectively. From top to bottom the curves correspond to 0, 6, 8, 10, 12, and 25% HFIP concentration.
FIGURE 2
FIGURE 2
Best fits to experimental CD data for polypeptide YGG-3V. Calculated results from models I and II are (inversed) transformed and shown as dashed and solid lines, respectively. From top to bottom the curves correspond to 0, 6, 7, 8, 10, and 20% HFIP concentration.
FIGURE 3
FIGURE 3
Using parameters linearly interpolated from Table II, helix content over an extended temperature range is shown for 4, 7, 8, 9, 10, 12, and 15% HFIP concentrations, which correspond to the solid line curves ordered from bottom to top in each panel. In panels (a) and (c) results are shown for polypeptide sCT(8 –32) with an effective chain length of 16, using models I and II, respectively. Also included are the symbols square, circle, and diamond corresponding to the transformed CD data onto fractional helix content for 8, 10, and 12% HFIP concentrations. Similarly, panels (b) and (d) show results for polypeptide YGG-3V with effective chain length of 18, using models I and II respectively. The symbol up triangle, square, and circle correspond to the transformed CD data onto fractional helix content for 7, 8, and 10%) HFIP concentrations.
FIGURE 4
FIGURE 4
Using parameters linearly interpolated from Table II, hydration content over an extended temperature range is shown for 0, 4, 8, 10, 12, and 15% HFIP concentrations. In panels (a) and (c), results are shown for polypeptide sCT(8 –32) with an effective chain length of 16, using models I and II, respectively. In panels (b) and (d) results are shown for polypeptide YGG-3V with an effective chain length of 18, using models I and II, respectively. Because hydration content curves cross, the symbols plus, square, circle, diamond, and filled down triangle) are added to identify the 4, 8, 12, and 15% HFIP concentrations. The solid line without any symbol corresponds to 0% HFIP concentration.
FIGURE 5
FIGURE 5
Using parameters linearly interpolated from Table II, H-bond content over an extended temperature range is shown for 15, 12, 10, 8, 4, and 0% HFIP concentrations, which correspond to the solid line curves ordered from top to bottom in each panel. In panels (a) and (c), results are shown for polypeptide sCT(8 –32) with effective chain length of 16, using models I and II respectively. Panels (b) and (d) show results for polypeptide YGG-3V with an effective chain length of 18, using models I and II, respectively. In all cases, no H-bond content is found at 0% HFIP concentration, and only a tiny amount is predicted by model II at 4% HFIP concentration.
FIGURE 6
FIGURE 6
Using model I parameters determined from Table II, predicted free energy (a), enthalpy (b), entropy (c), and heat capacity (d) are plotted over an extended temperature range for polypeptide sCT(8 –32) and effective chain length of 16. The colors black, red, green, blue, and magenta correspond to HFIP concentration of 6, 8, 10, 12, and 14%.
FIGURE 7
FIGURE 7
Using model II parameters determined from Table II, predicted free energy (a), enthalpy (b), entropy (c), and heat capacity (d) are plotted over an extended temperature range for polypeptide sCT(8 –32) and effective chain length of 16. The colors black, red, green, blue, and magenta correspond to HFIP concentration of 6, 8, 10, 12, and 14%.
FIGURE 8
FIGURE 8
Additional predictions for the sCT(8 –32) polypeptide with effective chain length of 16. In panels (a) and (b) the hydration and helix content are plotted HFIP concentration at four different temperatures. The (dashed, solid) lines correspond to (hydration, helix) content. Panels (c) and (d) show the heat capacity in units of cal/(mole K residue) for the same set of temperatures as a function of concentration. The black, red, green, and blue curves correspond to the temperatures of 275, 300, 325, and 350 K in all panels. Panels (a) and (c) are the predictions from model I, while model II predictions are shown in panels (b) and (d).
FIGURE 9
FIGURE 9
The free energy for three limiting thermodynamic states of a hypothetical infinite homogeneous chain is shown in panels (a) and (c) using best-fit parameters of model I and II at 8% HFIP concentration for polypeptide sCT(8–32) respectively. The (hydrated, helix, coil) states are shown as (long-dashed, solid, short-dashed) straight lines. Also, from bottom to top, a series of curves show the free energy obtained from DCM calculations for chain lengths 5, 10, 15, 20, 50, and 10000, respectively. Panel (b) plots the lowest free energy among the 3 limiting states (for model I) as a function of temperature at 0, 4, 8, 12, and 16% HFIP concentrations. The plus, square, and diamond symbols identify the 4, 8, and 12% cases. The lowest two lines without symbols, which form an upward “wedge,” correspond to the 0% case. Panel (d) is the same as (b) except model II is used. Note the helix state serves as a fixed reference between panels (a and b) and between (c and d) because Va and δa are independent of HFIP concentration.
FIGURE 10
FIGURE 10
Panel (a) shows (hydration, helix) content as (dashed, solid) lines for model I applied to the sCT(8–32) polypeptide at 4% HFIP concentration. Panel (c) shows the corresponding heat capacity. Similarly, panels (b) and (d) show results for model II. Two curves are shown for each quantity plotted. In all cases, the (bottom, top) curve corresponds to a chain length of (5, 10,000).
FIGURE 11
FIGURE 11
Panels (a) and (b) show helix content for models I and II, respectively, applied to the sCT(8–32) polypeptide at 8% HFIP concentration. From bottom to top, the curves correspond to chain lengths 5, 10, 15, 20, 25, 30, 40, 50, 100, and 10,000. Panel (c) shows the corresponding heat capacities for model I. From top to bottom at temperature 300 K the curves correspond to chain lengths 5, 10, 15, 20, 25, 30, 40, 50, 100, and 10000. In panel (d) the same ordering of chain lengths occur at 310 K for model II. Note that in pannels (c) and (d) the ordering of the curves differ at different temperatures because the heat capacity curves cross one another.
FIGURE 12
FIGURE 12
Panels (a) and (b) show helix content for models I and II respectively applied to the sCT(8–32) polypeptide at 12% HFIP concentration. From bottom to top the curves correspond to chain lengths 5, 10, 15, 20, 25, 50, and 10,000. Panels (c) and (d) show the corresponding heat capacities for models I and II, respectively. At 300 K, from top to bottom the curves correspond to chain lengths 5, 10, 15, 20, 25, 50, and 10,000. Note that at other temperatures the ordering is different as heat capacity curves cross one another.
FIGURE 13
FIGURE 13
Hydration content as a function of temperature for a variety of chain lengths is shown. Panels (a) and (b) respectively show the results of model I and II for the sCT(8–32) polypeptide at 8% HFIP concentration. From top to bottom the curves correspond to sizes 5, 15, 25, 40, 100, and 10000. Panels (c) and (d) show the corresponding information for models I and II at 12% HFIP concentration, where curves from top to bottom correspond to chain lengths of 5, 10, 15, and 20.
FIGURE 14
FIGURE 14
For the best-fit set of DCM parameters specified in Table II, linear fits between calculated fraction of helix content vs the raw CD experimental measurement is shown. Panels (a) and (c) show the results for model I and II, respectively, for polypeptide sCT(8–32), and the symbols down triangle, left triangle, up triangle, diamond, square, and circle correspond to 25, 12, 10, 8, 7, and 0% HFIP concentration. In (a) the 7% concentration is not shown for clarity. Likewise, panels (b) and (d) show models I and II results for polypeptide YGG-3V. The symbols down triangle, left triangle, up triangle, diamond, and circle correspond to 20, 10, 8, 7, and 0% HFIP concentration, where the 6% concentration is not shown for clarity. The solid straight lines through the data points are the linear least squares fits. The slopes and y-intercepts defining the linear transformation of Eq. six are given in Tables VIII and IX for polypeptides sCT(8–32) and YGG-3V.

Similar articles

Cited by

References

    1. Schellman JA. Compt-Rend Lab Carlsberg, Sér Chim. 1955;29(15):230–259. - PubMed
    1. Schellman JA. J Phys Chem. 1958;62:1485–1492.
    1. Kishimoto A, Mutai T, Araki K. Chem Commun (Camb) 2003;21(6):742–743. - PubMed
    1. Wallimann P, et al. J Am Chem Soc. 2003;125(5):1203–1220. - PubMed
    1. Lapidus LJ, Eaton WA, Hofricheter J. J Mol Biol. 2002;319(1):19–25. - PubMed

Publication types

LinkOut - more resources