. 2004 Oct 15;560(Pt 2):533-49.
doi: 10.1113/jphysiol.2004.066597. Epub 2004 Aug 12.

Stage-dependent dynamics and modulation of spontaneous waves in the developing rabbit retina

Affiliations

Stage-dependent dynamics and modulation of spontaneous waves in the developing rabbit retina

Mohsin Md Syed et al. J Physiol. .

Abstract

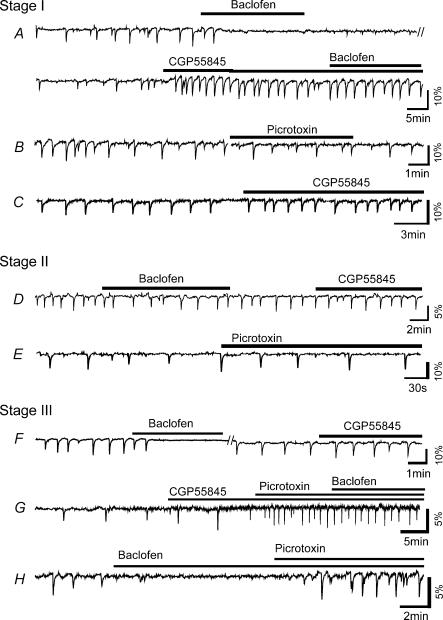
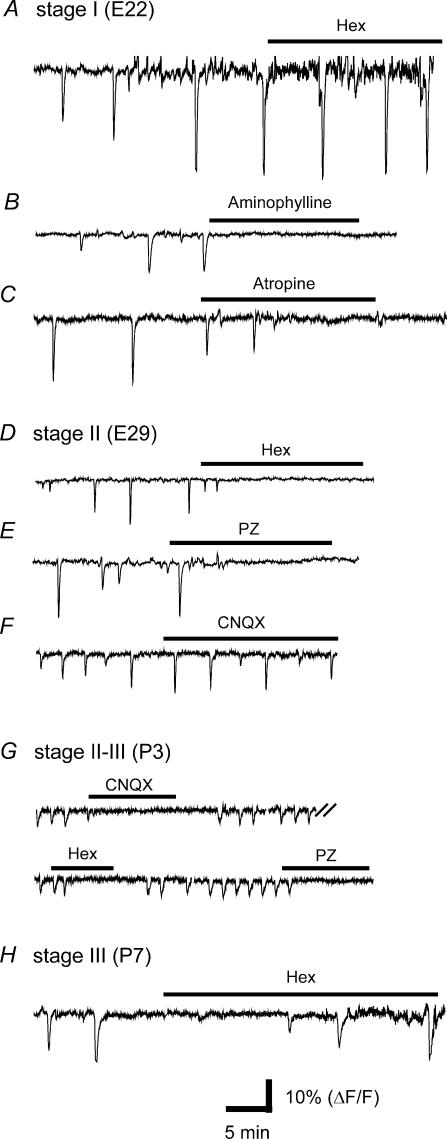
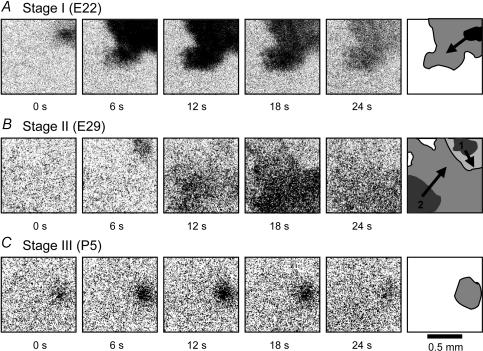
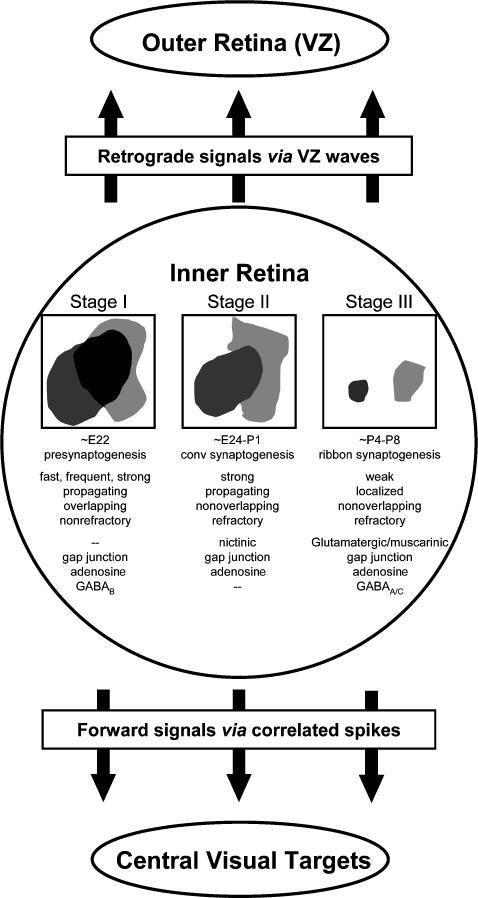
We report here a systematic investigation of the dynamics, regulation and distribution of spontaneous waves in the rabbit retina during the course of wave development prior to eye opening. Three major findings were obtained in this longitudinal study. (1) Spontaneous retinal waves underwent three developmental stages, each of which displayed distinct wave dynamics, pharmacology and mechanism of generation and regulation. Stage I waves emerged prior to synaptogenesis and appeared as frequent, fast propagating waves that did not form spatial boundaries between waves. These waves could be inhibited by blockers of gap junctions and adenosine receptors, but not by nicotinic antagonists. Stage I waves lasted about one day (around embryonic day 22) and then switched rapidly to stage II, resulting in slower and less frequent waves that could be blocked by nicotinic antagonists and had a characteristic postwave refractory period and spatial boundaries between adjacent waves. Immediately after the transition from stage I to stage II, the waves could be reverted back to stage I by blocking nicotinic receptors, indicating the presence of mutually compensatory mechanisms for wave generation. Stage III waves emerged around postnatal day 3-4 (P3-4), and they were mediated by glutamtergic and muscarinic interactions. With age, these waves became weaker, more localized and less frequent. Spontaneous waves were rarely detected after P7. (2) GABA strongly modulated the wave dynamics in a stage- and receptor type-dependent manner. At stage I, endogenous GABAB activation downregulated the waves. The GABAB modulation disappeared during stage II and was replaced by a strong GABA(A/C)-mediated inhibition at stage III. Blocking GABA(A/C) receptors not only dramatically enhanced spontaneous stage III waves, but also induced propagating waves in >P7 retinas that did not show spontaneous waves, indicating a role of GABA inhibition in the disappearance of spontaneous waves. (3) Spontaneous retinal waves were found in both the inner and outer retina at all three stages. The waves in the outer retina (ventricular zone) also showed stage-dependent pharmacology and dynamics. Together, the results revealed a multistaged developmental sequence and stage-dependent dynamics, pharmacology and regulation of spontaneous retinal waves in the mammalian retina. The presence of retinal waves during multiple developmental stages and in multiple retinal layers suggests that the waves are a general developmental phenomenon with diverse functions.


Figures

Figure 1
Figure 1. The earliest spontaneous waves in the developing rabbit retina
Simultaneous Ca2+ imaging and patch-clamp recording in the ganglion cell layer of an E22 rabbit retina loaded with Fura-2AM. Relative changes in fluorescence intensity (▵F/F) were averaged from the entire field of view (270 μm × 270 μm) under a 40× objective lens (top trace), showing rhythmic Ca2+ transients (downward deflections) appearing in synchrony with bursts of spikes (V) recorded from a current-clamped ganglion cell in the same field of view (the second trace, filtered and digitized at 20 and 50 Hz, respectively). Neither the Ca2+ transients, nor the spikes were blocked by a cocktail of common neurotransmitter receptor blockers, including 100 μm hexamethonium (Hex), 35 μm CNQX, 100 μm picrotoxin (Pic) and 4 μm strychnine (Strych). The third (filtered and digitized at 1 and 2 kHz, respectively) and fourth traces show an expanded view of a portion of the voltage trace and fluorescence changes, respectively. The fluorescence changes appeared to lead the spikes because the wave, which entered the field of view from outside of the frame, reached the area of imaging (the entire frame) before it reached the cell under patch clamp.
Figure 2
Figure 2. Pharmacology of the earliest spontaneous Ca2+ waves in the ganglion cell layer of E22 rabbits
A, the waves (downward deflections in ▵F/F) were not affected by a cocktail of antagonists, containing hexamethonium (Hex, 100 μm), atropine (2 μm), CNQX (50 μm), D-AP7 (100 μm), picrotoxin (100 μm) and strychnine (8 μm), but they were completely blocked by the gap junction blocker 18β-GA (75 μm). B, the spontaneous waves were also reversibly blocked by the adenosine receptor antagonist, aminophylline (500 μm). C, forskolin (1 μm) dramatically increased the frequency of spontaneous waves. D, blocking Ca2+ uptake into intracellular Ca2+ stores with thapsigargin (1 μm) produced a large transient increase in intracellular Ca2+, but did not block the rhythmic spontaneous Ca2+ waves. E, the purinergic receptor blocker, reactive blue-2 (50 μm), also completely blocked the spontaneous waves.
Figure 3
Figure 3. Stage-dependent wave dynamics in the ganglion cell layer (GCL)
Difference images (ΔF) were taken from Fura-2AM-loaded GCL at three developmental stages. The dark areas indicate regions of elevated intracellular Ca2+ associated with the wave. Each row shows two image frames of the same wave(s) together with a cartoon (right) depicting the propagation pattern of the wave(s). A, a stage I (E22) wave with a large wavefront and fast lateral propagation (upper row). When two stage I (E22) waves collided, they superimposed and passed through each other (lower row). B, a stage II (E29) wave propagating as a two-dimensional plane wave (upper row). When two stage II (E29) waves collided, they annihilated each other (lower row). C, stage III waves (P5) were weaker (smaller ΔF/F, also shown qualitatively in a lighter shade of grey in the cartoon) compared to other two stages. They sometimes showed clear lateral propagation (upper row), but most of the time appeared as a local burst of Ca2+ increases without clear lateral propagation (lower row). Movies showing the propagation of the waves in A (upper), B (upper) and C (lower) are provided in the Supplementary materials.
Figure 4
Figure 4. Comparison and transition between stage I and stage II waves
A, difference images (ΔF) of two consecutive stage I waves (upper) and two consecutive stage II waves (lower), showing the spatial coverage of each wave. The two stage I waves originated in the same area within 8 s, and they superimposed on one another without a boundary between them (upper row). The two stage II waves were separated by 82 s, yet still formed a clear boundary between them. B, relative fluorescence changes (ΔF/F) measured as a function of time from the small white circular regions indicated in A. The stage I waves (upper) were very frequent and showed intensity changes (ΔF/F) that were additive between the closely successive waves. Stage II waves (lower) had a long refractory period and obeyed clear spatial boundaries, resulting in a much longer interwave interval. Arrows indicate times when the images in A were taken. C, distributions of interwave intervals at stage I (upper) and stage II (lower), showing a minimum interwave interval of <5 s at stage I and 35 s at stage II. Waves that did not reach the central circle, such as the one at 82 s, were not counted in the calculation of interwave interval. The bin width in the histograms is 5 s. D, blocking stage II waves in the ganglion cell layer of an E22 retina with hexamethonium (Hex, 150 μm) induced the reappearance of stage I waves in the same retinal area. Application of Hex (150 μm) for the second time did not block the stage I waves.
Figure 5
Figure 5. Stage-dependent GABAA/C modulation of inner retinal wave dynamics
A, difference (ΔF) images of typical examples of stage I, II and III waves recorded under the control condition (upper row) and in the presence of 100 μm picrotoxin (lower row). Picrotoxin had no clear effect on stages I and II waves, but dramatically enhanced stage III waves. These images were selected to show the wavefront size typically seen under each recording condition. Scale bar: 0.5 mm. B, summary of the stage-dependent effects of GABAA/C antagonists (100 μm picrotoxin (PIC), or 100 μm SR95531 (SR)) on the percentage of waves that propagated, the wavefront speed and the interwave interval. Asterisks indicate values that are significantly (P < 0.012) different between control (CTL) and Pic/SR95331.
Figure 6
Figure 6. Modulation of wave dynamics by GABAA/C and GABAB activation
A, activation of GABAB receptors with baclofen (100 μm) completely and reversibly blocked stage I (E22) spontaneous waves in the ganglion cell layer. The GABAB antagonist CGP55485 (50 μm) increased the frequency of spontaneous waves at this age and prevented the blocking effect of baclofen. B, picrotoxin (100 μm) had no significant effect on wave frequency at stage I. C, CGP55845 (50 μm) increased stage I wave frequency in a retina that was never exposed to exogenous GABAB agonist, confirming the presence of endogenous GABAB inhibition of spontaneous waves. D, at stage II, baclofen (100 μm) only slightly reduced the wave frequency, but CGP55485 (50 μm) did not have any significant effect on the waves, suggesting a lack of endogenous GABAB modulation of stage II wave frequency. E, the GABAA antagonist, picrotoxin (100 μm), also did not have any significant effect on stage II wave frequency. F–H, baclofen (100 μm) blocked the spontaneous wave, but CGP55485 alone had no significant effect on the wave, suggesting a lack of endogenous GABAB effect on stage III waves. Picrotoxin (100 μm) dramatically increased stage III wave frequency. With the enhancement by picrotoxin, stage III waves were no longer blocked by baclofen (100 μm).
Figure 7
Figure 7. Developmental transition from GABAB to a GABAA/C modulation of retinal wave dynamics
Changes in spontaneous wave frequency (compared to control) caused by picrotoxin (PIC, 100 μm) and CGP95531 (CGP, 50 μm) are shown at three different stages. CGP significantly increased the wave frequency at stage I, but not at stage II or III, whereas PIC significantly increased wave frequency at stage III, but not at stage I or II. Asterisks indicate changes that are statistically significant (P < 0.01). Error bar: standard deviation.
Figure 8
Figure 8. Effects of gap junction blockers on stage II wave
A, octanol-1 (100 μm) reversibly blocked the spontaneous waves in the ganglion cell layer of an E30 retina. B, waves in an E29 retina were completely blocked by 18β-GA (75 μm). C, a low concentration of 18β-GA (15 μm) did not completely block the wave initiation but reduced the lateral propagation of the wave at E29. Scale bar: 0.5 mm.
Figure 9
Figure 9. Three pharmacological stages of VZ waves
A–C, stage I (E22) VZ waves were not blocked by the nicotinic antagonist, haemamethonium (Hex, 300 μm), but were completely blocked by aminophylline (150 μm, B) and atropine (1 μm, C). D–F, stage II (E29) VZ waves could be blocked by Hex (150 μm, D) and the muscarinic antagonist pirenzepine (PZ, 2 μm, E), but not by CNQX (30 μm, F). G, At P3, the VZ waves were blocked by CNQX (30 μm), Hex (150 μm) and pirenzepine (2 μm). H, Hex (300 μm) no longer blocked VZ waves at P7 (stage III).
Figure 10
Figure 10. Stage-dependent dynamics of VZ waves
A, difference images (ΔF) of a VZ wave at E22 (stage I), showing a strong intensity (large ΔF) and clear lateral propagation of the wavefront. B, two stage II (E29) VZ waves forming a spatial boundary between them. C, a stage III (P5) VZ wave, showing a low intensity (ΔF) and localized (non-propagating) spatial pattern. The cartoon drawn in the last frame of each row shows the direction of wave propagation (arrows), the initial wave size (dark region) and the spatial coverage (grey region) of the waves.
Figure 11
Figure 11. Modulation of VZ wave dynamics by GABAA/C and cholinesterase inhibitor
A, difference (ΔF) images of stage II (E30) VZ waves, showing the spatial extent of the wave (dark regions) in control, picrotoxin (Pic, 100 μm) and neostigmine (NS, 4 μm). The waves were dramatically enhanced by NS, but not by Pic at this stage. B, VZ waves at P3, showing a localized pattern in control, a modest enhancement in the presence of NS (4 μm) and a dramatic enhancement of wave intensity and lateral propagation in the combined presence of NS (4 μm) and Pic (100 μm). All frames were selected to show the typical wavefront size under each recording condition. Scale bar: 0.5 mm.
Figure 12
Figure 12. Developmental stages of spontaneous waves in the rabbit retina prior to eye opening
Spontaneous waves in the inner retina developed through three stages. Stage I waves were frequent, fast-propagating and non-refractory (did not form boundaries, as indicated by the overlap between two waves). They were inhibited by gap junction and adenosine receptor blockers and were downmodulated by GABAB activation. Stage II waves were propagating, refractory and non-overlapping, and were inhibited by nicotinic and gap junction blockers. Stage III waves were weak and localized. They were sensitive to glutamatergic, muscarinic and gap junction blockers, and were strongly inhibited by GABAA/C activation. All three stages of IR waves propagated to the outer retina (ventricular zone), thus sending both retrograde signals to the outer retina via VZ waves and forward signals to the central visual targets via correlated spikes.

Similar articles

Cited by

References

    1. Ames A, Nesbett FB. In vitro retina as an experimental model of the central nervous system. J Neurochem. 1981;37:867–877. - PubMed
    1. Bansal A, Singer JH, Hwang BJ, Xu W, Beaudet A, Feller MB. Mice lacking specific nicotinic acetylcholine receptor subunits exhibit dramatically altered spontaneous activity patterns and reveal a limited role for retinal waves in forming ON and OFF circuits in the inner retina. J Neurosci. 2000;20:7672–7681. - PMC - PubMed
    1. Ben-Ari Y. Excitatory actions of GABA during development: the nature of the nurture. Nat Rev Neurosci. 2002;3:728–739. - PubMed
    1. Burnstock G, Williams M. P2 purinergic receptors: modulation of cell function and therapeutic potential. J Pharmacol Exp Ther. 2000;295:862–869. - PubMed
    1. Catsicas M, Bonness V, Becker D, Mobbs P. Spontaneous Ca2+ transients and their transmission in the developing chick retina. Curr Biol. 1998;8:283–286. - PubMed

Publication types