

Effect of low cytoplasmic [ATP] on excitation-contraction coupling in fast-twitch muscle fibres of the rat
- PMID: 15308682
- PMCID: PMC1665263
- DOI: 10.1113/jphysiol.2004.069112
Effect of low cytoplasmic [ATP] on excitation-contraction coupling in fast-twitch muscle fibres of the rat
Abstract
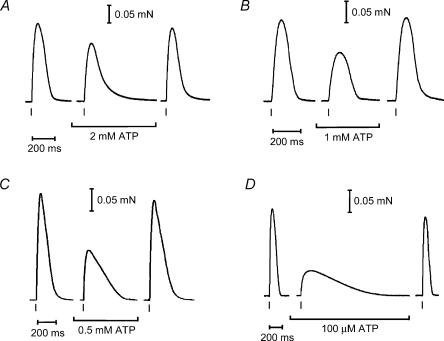
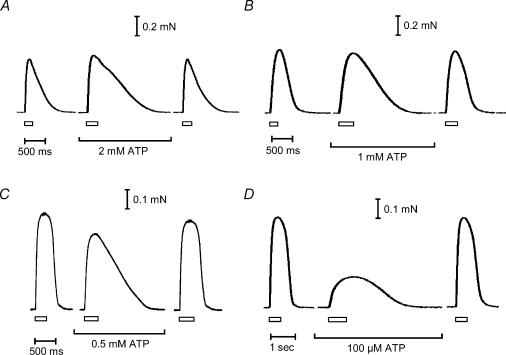
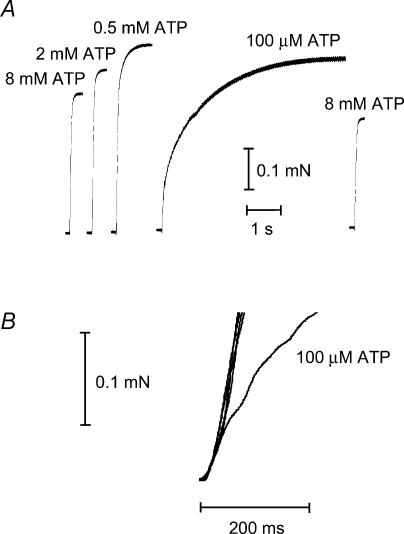
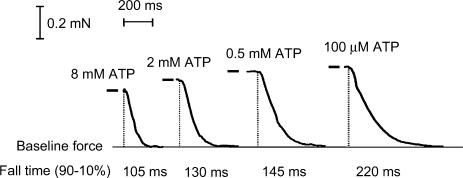
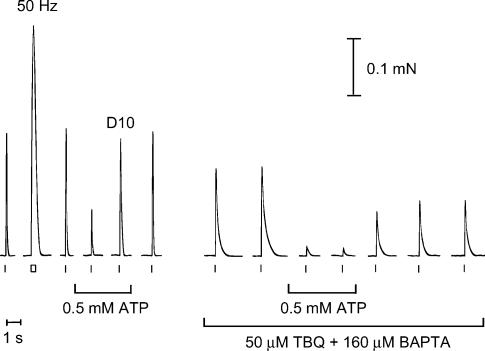
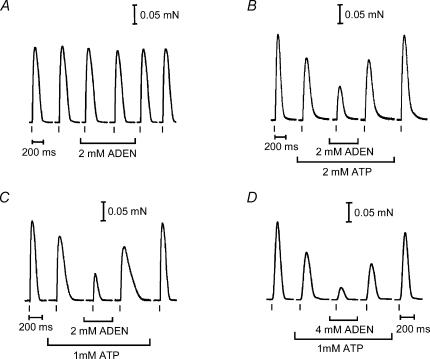
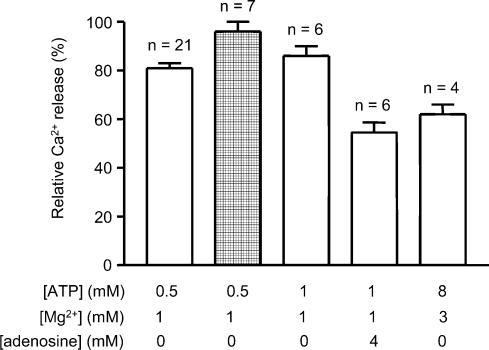
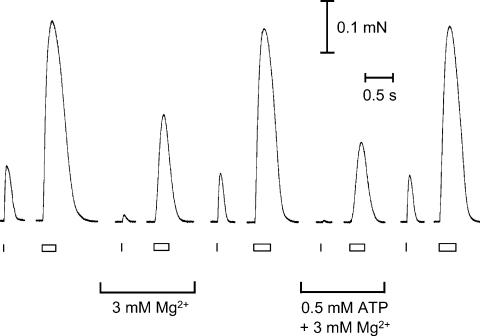
In this study we investigated the roles of cytoplasmic ATP as both an energy source and a regulatory molecule in various steps of the excitation-contraction (E-C) coupling process in fast-twitch skeletal muscle fibres of the rat. Using mechanically skinned fibres with functional E-C coupling, it was possible to independently alter cytoplasmic [ATP] and free [Mg2+]. Electrical field stimulation was used to elicit action potentials (APs) within the sealed transverse tubular (T-) system, producing either twitch or tetanic (50 Hz) force responses. Measurements were also made of the amount of Ca2+ released by an AP in different cytoplasmic conditions. The rate of force development and relaxation of the contractile apparatus was measured using rapid step changes in [Ca2+]. Twitch force decreased substantially (approximately 30%) at 2 mm ATP compared to the level at 8 mm ATP, whereas peak tetanic force only declined by approximately 10% at 0.5 mm ATP. The rate of force development of the twitch and tetanus was slowed only slightly at [ATP] > or = 0.5 mm, but was slowed greatly (> 6-fold) at 0.1 mm ATP, the latter being due primarily to slowing of force development by the contractile apparatus. AP-induced Ca2+ release was decreased by approximately 10 and 20% at 1 and 0.5 mm ATP, respectively, and by approximately 40% by raising the [Mg2+] to 3 mm. Adenosine inhibited Ca2+ release and twitch responses in a manner consistent with its action as a competitive weak agonist for the ATP regulatory site on the ryanodine receptor (RyR). These findings show that (a) ATP is a limiting factor for normal voltage-sensor activation of the RyRs, and (b) large reductions in cytoplasmic [ATP], and concomitant elevation of [Mg2+], substantially inhibit E-C coupling and possibly contribute to muscle fatigue in fast-twitch fibres in some circumstances.
Figures
Similar articles
-
Calcium phosphate precipitation in the sarcoplasmic reticulum reduces action potential-mediated Ca2+ release in mammalian skeletal muscle.Am J Physiol Cell Physiol. 2005 Dec;289(6):C1502-12. doi: 10.1152/ajpcell.00273.2005. Epub 2005 Aug 10. Am J Physiol Cell Physiol. 2005. PMID: 16093278
-
Effect of sarcoplasmic reticulum Ca2+ content on action potential-induced Ca2+ release in rat skeletal muscle fibres.J Physiol. 2003 Aug 15;551(Pt 1):219-37. doi: 10.1113/jphysiol.2003.040022. Epub 2003 Jul 4. J Physiol. 2003. PMID: 12844504 Free PMC article.
-
Effects of oxidation and cytosolic redox conditions on excitation-contraction coupling in rat skeletal muscle.J Physiol. 2003 Mar 15;547(Pt 3):807-23. doi: 10.1113/jphysiol.2002.035204. Epub 2003 Jan 31. J Physiol. 2003. PMID: 12562929 Free PMC article.
-
Voltage-sensor control of Ca2+ release in skeletal muscle: insights from skinned fibers.Front Biosci. 2002 Apr 1;7:d834-42. doi: 10.2741/A815. Front Biosci. 2002. PMID: 11897557 Review.
-
Excitation-contraction coupling and fatigue mechanisms in skeletal muscle: studies with mechanically skinned fibres.J Muscle Res Cell Motil. 2002;23(1):81-91. doi: 10.1023/a:1019932730457. J Muscle Res Cell Motil. 2002. PMID: 12363289 Review.
Cited by
-
Repeated-sprint ability - part I: factors contributing to fatigue.Sports Med. 2011 Aug 1;41(8):673-94. doi: 10.2165/11590550-000000000-00000. Sports Med. 2011. PMID: 21780851 Review.
-
Ca2+ Release Channels Join the 'Resolution Revolution'.Trends Biochem Sci. 2017 Jul;42(7):543-555. doi: 10.1016/j.tibs.2017.04.005. Epub 2017 May 9. Trends Biochem Sci. 2017. PMID: 28499500 Free PMC article. Review.
-
Effect of ADP on slow-twitch muscle fibres of the rat: implications for muscle fatigue.J Physiol. 2006 May 15;573(Pt 1):187-98. doi: 10.1113/jphysiol.2006.105775. Epub 2006 Mar 23. J Physiol. 2006. PMID: 16556653 Free PMC article.
-
Chloride conductance in the transverse tubular system of rat skeletal muscle fibres: importance in excitation-contraction coupling and fatigue.J Physiol. 2008 Feb 1;586(3):875-87. doi: 10.1113/jphysiol.2007.144667. Epub 2007 Nov 22. J Physiol. 2008. PMID: 18033812 Free PMC article.
-
Store-operated Ca2+ entry during intracellular Ca2+ release in mammalian skeletal muscle.J Physiol. 2007 Aug 15;583(Pt 1):81-97. doi: 10.1113/jphysiol.2007.135046. Epub 2007 Jun 14. J Physiol. 2007. PMID: 17569733 Free PMC article.
References
-
- Allen DG, Lännergren J, Westerblad H. Muscle cell function during prolonged activity: cellular mechanisms of fatigue. Exp Physiol. 1995;80:497–527. - PubMed
-
- Allen DG, Lännergren J, Westerblad H. The use of caged adenosine nucleotides and caged phosphate in intact skeletal muscle fibres of the mouse. Acta Physiol Scand. 1999;166:341–347. - PubMed
-
- Barrett-Jolley R, Davies NW. Kinetic analysis of the inhibitory effect glibenclamide on KATP channels of mammalian skeletal muscle. J Membr Biol. 1997;155:257–262. - PubMed
Publication types
MeSH terms
Substances
LinkOut - more resources
Full Text Sources
Miscellaneous