. 2004 Sep;78(17):9458-73.
doi: 10.1128/JVI.78.17.9458-9473.2004.

Host cell gene expression during human immunodeficiency virus type 1 latency and reactivation and effects of targeting genes that are differentially expressed in viral latency

Affiliations

Host cell gene expression during human immunodeficiency virus type 1 latency and reactivation and effects of targeting genes that are differentially expressed in viral latency

Vyjayanthi Krishnan et al. J Virol. 2004 Sep.

Abstract

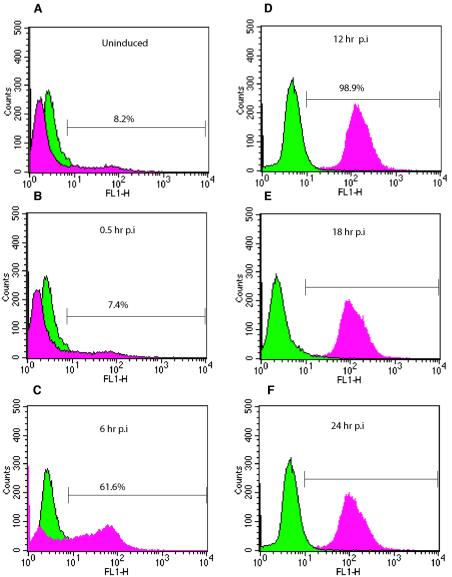
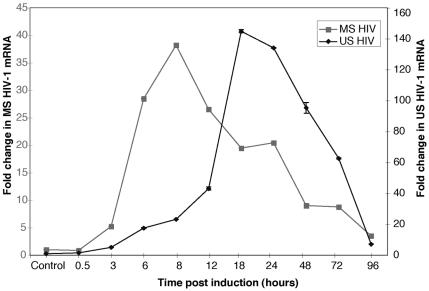
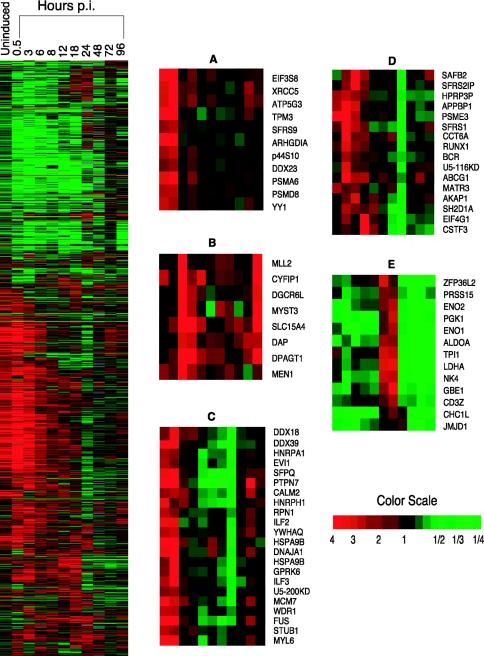
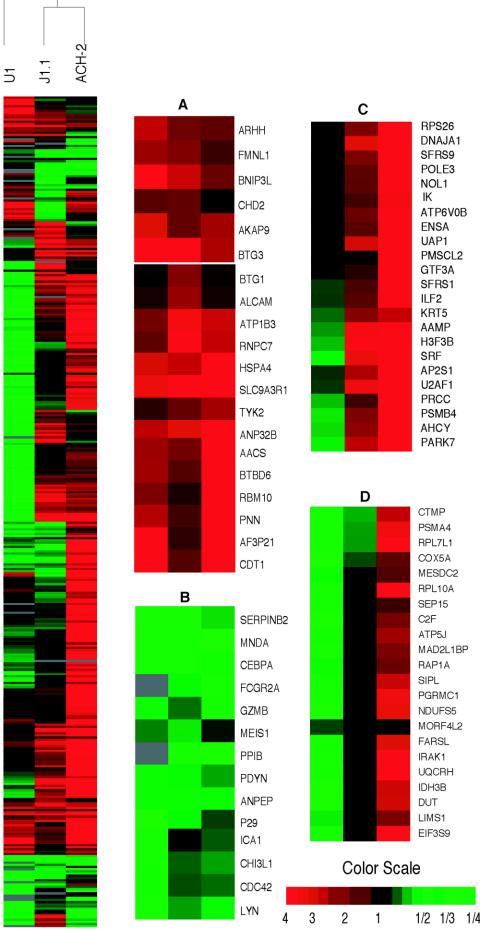
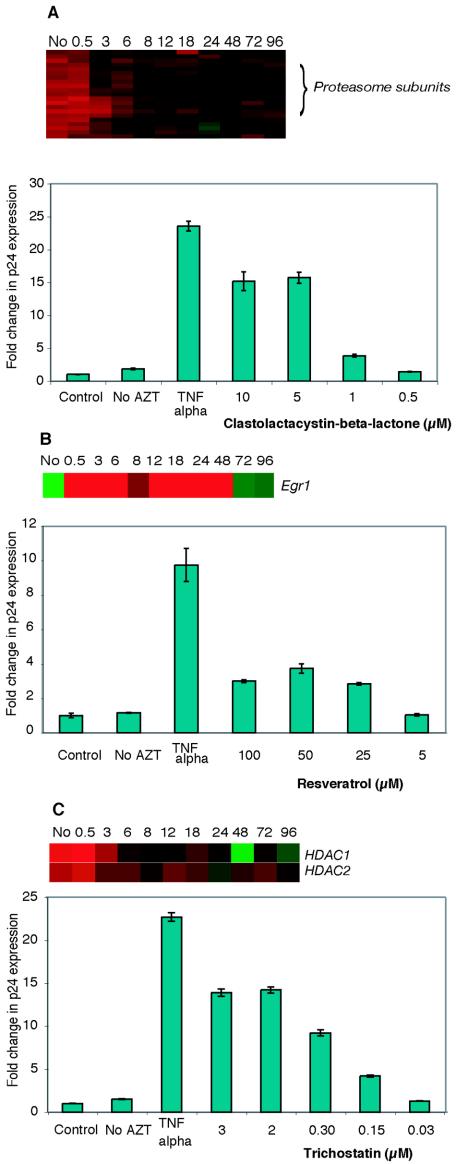
The existence of reservoirs of cells latently infected with human immunodeficiency virus (HIV) is a major obstacle to the elimination of HIV infection. We studied the changes in cellular gene expression that accompany the reactivation and completion of the lytic viral cycle in cell lines chronically infected with HIV-1. We found that several genes exhibited altered expression in the chronically infected cells compared to the uninfected parental cells prior to induction into lytic replication. A number of gene classes showed increased expression in the chronically infected cells, notably including genes encoding proteasomes, histone deacetylases, and many transcription factors. Following induction of the lytic replication cycle, we observed ordered, time-dependent changes in the cellular gene expression pattern. Approximately 1,740 genes, many of which fall into 385 known pathways, were differentially expressed (P < 0.001), indicating that completion of the HIV replication cycle is associated with distinct, temporally ordered changes in host cell gene expression. Maximum changes were observed in the early and intermediate phases of the lytic replication cycle. Since the changes in gene expression in chronically infected cells suggested that cells latently infected with HIV have a different gene expression profile than corresponding uninfected cells, we studied the expression profiles of three different chronically infected cell lines to determine whether they showed similar changes in common cellular genes and pathways. Thirty-two genes showed significant differential expression in all cell lines studied compared to their uninfected parental cell lines. Notable among them were cdc42 and lyn, which were downregulated and are required for HIV Nef binding and viral replication. Other genes previously unrelated to HIV latency or pathogenesis were also differentially expressed. To determine the effects of targeting products of the genes that were differentially expressed in latently infected cells, we treated the latently infected cells with a proteasome inhibitor, clastolactacystin-beta-lactone (CLBL), and an Egr1 activator, resveratrol. We found that treatment with CLBL and resveratrol stimulated lytic viral replication, suggesting that treatment of cells with agents that target cellular genes differentially expressed in latently infected cells can stimulate lytic replication. These findings may offer new insights into the interaction of the latently infected host cell and HIV and suggest therapeutic approaches for inhibiting HIV infection and for manipulating cells latently infected with HIV so as to trigger lytic replication.


Figures

FIG. 1.
FIG. 1.
Flow cytometric analysis of chronically infected ACH-2 cells before and after induction. Uninduced cells and cells from serial time points were fixed and permeabilized for intracellular p24 labeling. As an isotype control, cell samples were labeled with mouse IgG1. For each sample, 100,000 events were collected. Each sample histogram labeled for p24 (red) is overlaid with the control histogram labeled for the isotype control (green). (A) Uninduced ACH-2 cells, showing minimal p24 accumulation with 8.2% of cells infected. (B) ACH-2 cells at 0.5 h postinduction (p.i.) with 7.4% of cells positive for p24. (C) ACH-2 cells at 6 h postinduction, with 61.6% of cells infected. (D, E, and F) ACH-2 cells at 12, 18, and 24 h postinduction, respectively, showing complete infection. Flow cytometric analysis was performed on all batches of cells to ensure active replication of HIV following induction with PMA. Data from one induction experiment are shown. The data indicate that viral replication occurs in an ordered manner postinduction and that complete infection of cells is achieved within 12 h postinduction of chronically infected ACH-2 cells.
FIG. 2.
FIG. 2.
Levels of expression of multiply spliced (MS) and unspliced (US) HIV-1 mRNA pre- and postinduction of chronically infected ACH-2 cells. Real-time RT-PCRs were carried out with Taqman probes specific for early (multiply spliced) and late (unspliced) transcripts of HIV-1 and tagged with FAM and TAMRA fluorescent dyes at the 5′ and 3′ ends, respectively. Reactions were performed in triplicate for each time point as described in Materials and Methods, and average values are shown. Maximal changes in mRNA levels for early transcripts (multiply spliced) were observed at 8 h postinduction. The changes for late transcripts (unspliced) showed a maximal increase at 18 h postinduction.
FIG. 3.
FIG. 3.
Hierarchical clustering of differentially expressed cellular genes before and after induction of chronically infected ACH-2 cells. The figure shows the hierarchical clustering of the cellular genes that showed significant differential expression (P < 0.001) across the time course (before induction up to 96 h postinduction) following reactivation of chronically infected ACH-2 cells as described in the text. Genes shown in red showed upregulation, those in green were downregulated, while those that did not show any change with respect to a normalized matched control are shown in black. The gray areas indicate missing data for the given gene and time point. The magnified panels indicate selected kinetic profiles that were seen before and following induction into active viral replication. (A) Upregulation of selected genes observed before induction; (B) upregulation of genes immediately following induction; (C) genes that are upregulated prior to induction and downregulated 12 to 24 h postinduction; (D) genes that are upregulated in the early stage following reactivation but downregulated in the intermediate stage; (E) genes that are downregulated before induction but upregulated in the intermediate stage followed by downregulation in the late stage (48 to 96 h postinduction).
FIG. 4.
FIG. 4.
Trends seen in pathways that show differential expression before and after induction of chronically infected ACH-2 cells. Pathway profiles observed prior to induction and following reactivation of ACH-2 cells with PMA over a period of 96 h. The figure shows the number of genes in each pathway that were differentially expressed in a particular pathway. (A) Pathways that were maximally altered prior to induction. (B) Pathways that showed maximum change during the early phase of the lytic cycle (0.5 to 8 h postinduction). (C) Pathways that showed maximal change during from 12 to 24 h postinduction. Most pathways did not show any change during the period from 48 to 96 h postinduction. The groups above are a selected representation of the various pathways that changed differentially prior to induction and/or over the time course studied. Classification of the altered genes into various pathways was performed with the CGAP pathway databases.
FIG. 5.
FIG. 5.
Hierarchical clustering of genes that showed differential expression across three chronically infected cell lines prior to induction. Hierarchical clustering of differentially expressed genes that showed a significant change in expression (P < 0.001) in the chronically infected cell lines ACH-2, U1, and J1.1. Genes shown in red were upregulated, those in green exhibited downregulation, and black indicates normal expression. Gray areas indicate missing values. Many genes were altered similarly across the cell lines. Each cell line also showed some unique patterns of cellular expression. Data are the averages of values from eight independent samples per cell line. The magnified portions of the cluster highlight some of the patterns of gene expression across the cell lines. (A) Genes that were upregulated in all three cell lines; (B) genes that were downregulated in all three cell lines; (C) genes that were upregulated in ACH-2 and J1.1 and downregulated in U1 cells; (D) genes which showed no significant similarity in their expression in the three cell lines.
FIG. 6.
FIG. 6.
Effects of specific agents on HIV p24 production in chronically infected ACH-2 cells. Different concentrations of (A) the proteasome inhibitor clastolactacystin-beta-lactone, (B) resveratrol, an Egr1 activator, or (C) trichostatin, a histone deacetylase inhibitor were tested in chronically infected ACH-2 cells treated with 250 nM AZT. Samples were collected 24 h after addition of agent, and p24 concentrations were determined by enzyme-linked immunosorbent assay. p24 production in cells treated with tumor necrosis factor alpha (TNFα) was used as a positive control in ACH-2 cells compared to control (AZT-treated) cells. p24 production in untreated cells (no AZT) was also determined. Experiments were performed in triplicate, and values are representative of three independent experiments. Microarray data for the specific genes targeted are shown for each agent tested.

References

    1. Adams, J. 2003. Potential for proteasome inhibition in the treatment of cancer. Drug Discov. Today 8:307-315. - PubMed
    1. Adams, J. 2001. Proteasome inhibition in cancer: development of PS-341. Semin. Oncol. 28:613-619. - PubMed
    1. Adams, J. 2003. The proteasome: structure, function, and role in the cell. Cancer Treat. Rev. 29(Suppl. 1):3-9. - PubMed
    1. Arendt, C. W., and D. R. Littman. 2001. HIV: master of the host cell. Genome Biol. 2:1030.1-1030.4. - PMC - PubMed
    1. Ashburner, M., C. A. Ball, J. A. Blake, D. Botstein, H. Butler, J. M. Cherry, A. P. Davis, K. Dolinski, S. S. Dwight, J. T. Eppig, M. A. Harris, D. P. Hill, L. Issel-Tarver, A. Kasarskis, S. Lewis, J. C. Matese, J. E. Richardson, M. Ringwald, G. M. Rubin, and G. Sherlock. 2000. Gene ontology: tool for the unification of biology. The Gene Ontology Consortium. Nat. Genet. 25:25-29. - PMC - PubMed

Publication types

MeSH terms