Functional immunomics: microarray analysis of IgG autoantibody repertoires predicts the future response of mice to induced diabetes
- PMID: 15308778
- PMCID: PMC521990
- DOI: 10.1073/pnas.0404848101
Functional immunomics: microarray analysis of IgG autoantibody repertoires predicts the future response of mice to induced diabetes
Abstract
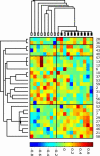
One's present repertoire of antibodies encodes the history of one's past immunological experience. Can the present autoantibody repertoire be consulted to predict resistance or susceptibility to the future development of an autoimmune disease? Here, we developed an antigen microarray chip and used bioinformatic analysis to study a model of type 1 diabetes developing in nonobese diabetic male mice in which the disease was accelerated and synchronized by exposing the mice to cyclophosphamide at 4 weeks of age. We obtained sera from 19 individual mice, treated the mice to induce cyclophosphamide-accelerated diabetes (CAD), and found, as expected, that 9 mice became severely diabetic, whereas 10 mice permanently resisted diabetes. We again obtained serum from each mouse after CAD induction. We then analyzed, by using rank-order and superparamagnetic clustering, the patterns of antibodies in individual mice to 266 different antigens spotted on the chip. A selected panel of 27 different antigens (10% of the array) revealed a pattern of IgG antibody reactivity in the pre-CAD sera that discriminated between the mice resistant or susceptible to CAD with 100% sensitivity and 82% specificity (P = 0.017). Surprisingly, the set of IgG antibodies that was informative before CAD induction did not separate the resistant and susceptible groups after the onset of CAD; new antigens became critical for post-CAD repertoire discrimination. Thus, at least for a model disease, present antibody repertoires can predict future disease, predictive and diagnostic repertoires can differ, and decisive information about immune system behavior can be mined by bioinformatic technology. Repertoires matter.
Figures


Similar articles
-
The natural autoantibody repertoire in newborns and adults: a current overview.Adv Exp Med Biol. 2012;750:198-212. doi: 10.1007/978-1-4614-3461-0_15. Adv Exp Med Biol. 2012. PMID: 22903676 Review.
-
Autoantibody patterns in diabetes-prone NOD mice and in standard C57BL/6 mice.J Autoimmun. 2001 Nov;17(3):191-7. doi: 10.1006/jaut.2001.0544. J Autoimmun. 2001. PMID: 11712856
-
Analysis of mercury-induced immune activation in nonobese diabetic (NOD) mice.Clin Exp Immunol. 2001 Aug;125(2):202-10. doi: 10.1046/j.1365-2249.2001.01580.x. Clin Exp Immunol. 2001. PMID: 11529910 Free PMC article.
-
Anti-serum with anti-autoantibody activity decreases autoantibody-positive B lymphocytes and type 1 diabetes of female NOD mice.Autoimmunity. 2016;49(1):21-30. doi: 10.3109/08916934.2015.1079819. Epub 2015 Aug 31. Autoimmunity. 2016. PMID: 26334951
-
International Workshop on Lessons From Animal Models for Human Type 1 Diabetes: identification of insulin but not glutamic acid decarboxylase or IA-2 as specific autoantigens of humoral autoimmunity in nonobese diabetic mice.Diabetes. 2001 Nov;50(11):2451-8. doi: 10.2337/diabetes.50.11.2451. Diabetes. 2001. PMID: 11679421 Review.
Cited by
-
Lipids and lipid-reactive antibodies as biomarkers for multiple sclerosis.J Neuroimmunol. 2012 Jul 15;248(1-2):53-7. doi: 10.1016/j.jneuroim.2012.01.002. Epub 2012 May 12. J Neuroimmunol. 2012. PMID: 22579051 Free PMC article. Review.
-
Tracing environmental markers of autoimmunity: introducing the infectome.Immunol Res. 2013 Jul;56(2-3):220-40. doi: 10.1007/s12026-013-8399-6. Immunol Res. 2013. PMID: 23592050 Free PMC article. Review.
-
High-content T-cell and B-cell analysis.Clin Rev Allergy Immunol. 2007 Feb;32(1):75-84. doi: 10.1007/BF02686084. Clin Rev Allergy Immunol. 2007. PMID: 17426363
-
Network theory analysis of antibody-antigen reactivity data: the immune trees at birth and adulthood.PLoS One. 2011 Mar 8;6(3):e17445. doi: 10.1371/journal.pone.0017445. PLoS One. 2011. PMID: 21408156 Free PMC article.
-
Overexpression of the Ctla-4 isoform lacking exons 2 and 3 causes autoimmunity.J Immunol. 2012 Jan 1;188(1):155-62. doi: 10.4049/jimmunol.1102042. Epub 2011 Nov 28. J Immunol. 2012. PMID: 22124121 Free PMC article.
References
-
- Abbas, A. K., Lichtman, A. H. & Pober, J. S. (1994) Cellular and Molecular Immunology (Saunders, Philadelphia).
-
- Martin, R., Jaraquemada, D., Flerlage, M., Richert, J., Whitaker, J., Long, E. O., McFarlin, D. E. & McFarland, H. F. (1990) J. Immunol. 145, 540-548. - PubMed
-
- Moudgil, K. D. & Sercarz, E. E. (2000) Rev. Immunogenet. 2, 26-37. - PubMed
-
- Lacroix-Desmazes, S., Kaveri, S. V., Mouthon, L., Ayouba, A., Malanchere, E., Coutinho, A. & Kazatchkine, M. D. (1998) J. Immunol. Methods 216, 117-137. - PubMed
Publication types
MeSH terms
Substances
LinkOut - more resources
Full Text Sources
Other Literature Sources
Medical
Miscellaneous

