. 2004 Aug 14:5:111.
doi: 10.1186/1471-2105-5-111.

Alternative mapping of probes to genes for Affymetrix chips

Affiliations

Alternative mapping of probes to genes for Affymetrix chips

Laurent Gautier et al. BMC Bioinformatics. .

Abstract

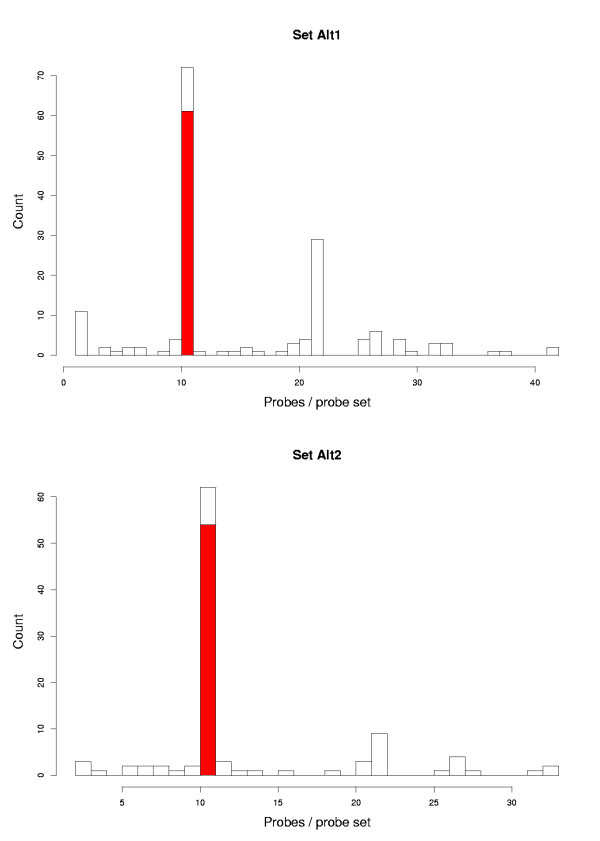
Background: Short oligonucleotide arrays have several probes measuring the expression level of each target transcript. Therefore the selection of probes is a key component for the quality of measurements. However, once probes have been selected and synthesized on an array, it is still possible to re-evaluate the results using an updated mapping of probes to genes, taking into account the latest biological knowledge available.

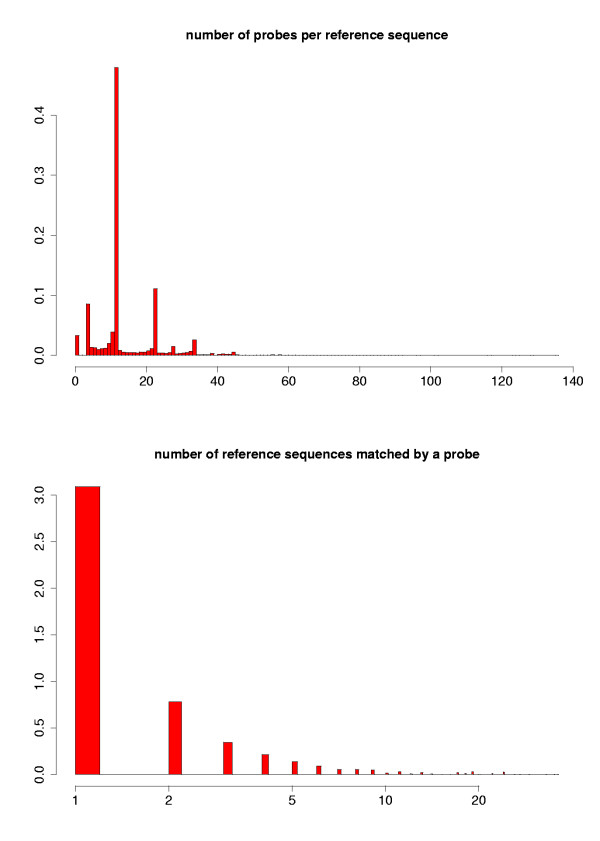
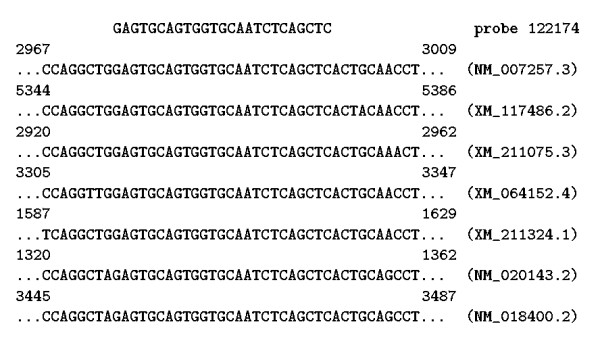
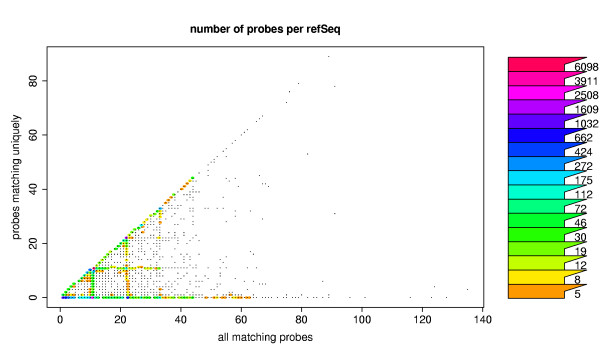
Methods: We investigated how probes found on recent commercial microarrays for human genes (Affymetrix HG-U133A) were matching a recent curated collection of human transcripts: the NCBI RefSeq database. We also built mappings and used them in place of the original probe to genes associations provided by the manufacturer of the arrays.

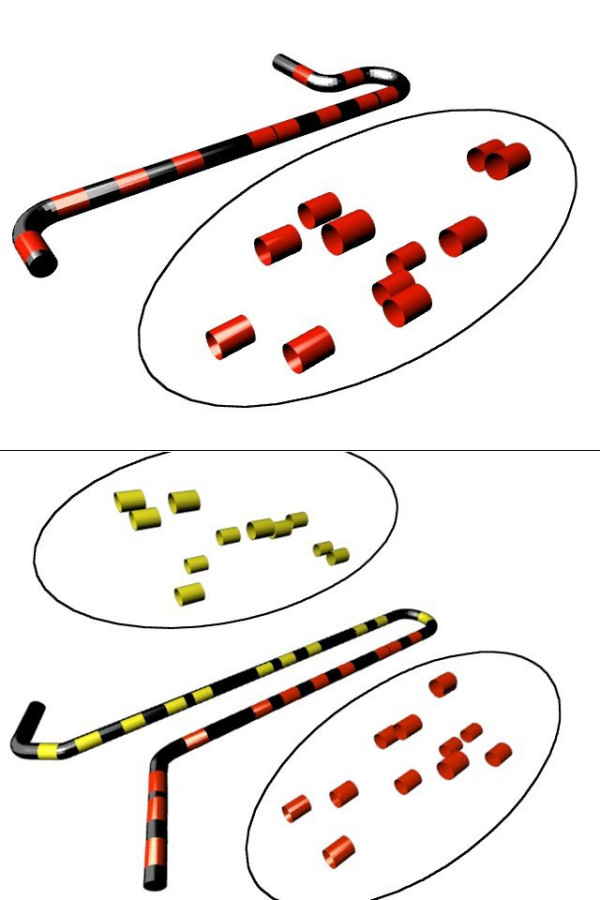
Results: In a large number of cases, 36%, the probes matching a reference sequence were consistent with the grouping of probes by the manufacturer of the chips. For the remaining cases there were discrepancies and we show how that can affect the analysis of data.

Conclusions: While the probes on Affymetrix arrays remain the same for several years, the biological knowledge concerning the genomic sequences evolves rapidly. Using up-to-date knowledge can apparently change the outcome of an analysis.


Figures

Figure 1
Figure 1
Histrograms for the number of probes per probe set. Both plots are histogram, the values on the y axis are relative frequencies. (top) Histogram of the number of probes on the U133A chip matching a particular RefSeq transcript. A clear peak can be seen for 11 probes, which corresponds to the number of probes in a probe set most commonly found in the original mapping. This set is called Alt1 in the last part of the section Results. (bottom) Histogram of number of RefSeq transcripts matching a single probe (log scale). Most of the probes can be seen matching only one RefSeq. In both plots, the probes associated to human 'ALU' repeats were filtered out.
Figure 2
Figure 2
Reference sequences matching the probe 122174. The reference sequences matching the probe 122174, assigned to the probe set 211697_x_at and annotated 'Homo sapiens RNA-binding protein LOC56902 mRNA, complete cds' in the original mapping. NCBI's reference sequences are annotated 'paraneoplastic antigen MA2 (PNMA2), mRNA', 'LOC202934 (LOC202934), mRNA', 'hypothetical protein LOC283507 (LOC283507), mRNA', 'sarcalumenin (SRL), mRNA', 'LOC284095 (LOC284095), mRNA', 'putative 28 kDa protein (LOC56902), mRNA' and 'sodium channel, voltage-gated, type III, beta (SCN3B), mRNA' respectively
Figure 3
Figure 3
Probes, probe sets and reference sequence. Reference sequence matching all the probes from probe sets in the official mapping. The reference sequence is represented by a long dark cylinder, while the matching probes are represented by red or yellow fragments of cylinder. The wire frame represents the grouping of probes in a probe set in the official mapping. (Top:) All the probes matching the reference sequence constitute a probe set in the official mapping. (Bottom:) All the probes matching the reference sequence constitute two different probe sets in the official mapping.
Figure 4
Figure 4
Scatter plots for the number of probes matching a reference sequence. Scatter plot of the total number of probes matching a reference sequence against the number of probes remaining after removing the probes matching several reference sequences. Colored areas are displayed to indicate the z-axis, the number of probes occupying each spot in the graph. A grid-like pattern can be observed in the lower-left corner of the plot. The size of the cells is 11 probes, which is the number of probes contained in most of the probe sets in the official mapping.
Figure 5
Figure 5
Histograms of the number of probes per probe in the SDEGs. Distribution of the number of probes per probe set in the sets of significantly differentially expressed genes for the set Alt1 (top) and the set Alt2 (bottom). The probe sets for which an identical probe set could be found in the Affy set are represented in red.

References

    1. Lockhart DJ, Dong H, Byrne MC, Follettie MT, Gallo MV, Chee MS, Mittmann M, Wang C, Kobayashi M, Horton H, Brown EL. Expression Monitoring by hybridization to high-density oligonucleotide arrays. Nature Biotechnology. 1996;14:1675–1680. doi: 10.1038/nbt1296-1675. - DOI - PubMed
    1. Affymetrix Affymetrix Microarray Suite User Guide. version 4, Affymetrix, Santa Clara, CA. 1999.
    1. Lazaridis E, Sinibaldi D, Bloom G, Mane S, Jove R. A simple method to improve probe set estimates from oligonucleotides arrays. Mathematical Biosciences. 2002;176:53–58. doi: 10.1016/S0025-5564(01)00100-6. - DOI - PubMed
    1. Li C, Wong W. Model-based analysis of oligonucleotide arrays: Expression index computation and outlier detection. Proceedings of the National Academy of Science U S A. 2001;98:31–36. doi: 10.1073/pnas.011404098. - DOI - PMC - PubMed
    1. Irizarry RA, Bolstad BM, Collin F, Cope LM, Hobbs B, Speed TP. Summaries of Affymetrix GeneChip probe level data. Nucleic Acids Research. 2003;31 - PMC - PubMed

Publication types

MeSH terms