. 2004 Aug;135(4):2301-17.
doi: 10.1104/pp.104.043000. Epub 2004 Aug 13.

Dynamic changes in the osmotic water permeability of protoplast plasma membrane

Affiliations

Dynamic changes in the osmotic water permeability of protoplast plasma membrane

Menachem Moshelion et al. Plant Physiol. 2004 Aug.

Abstract

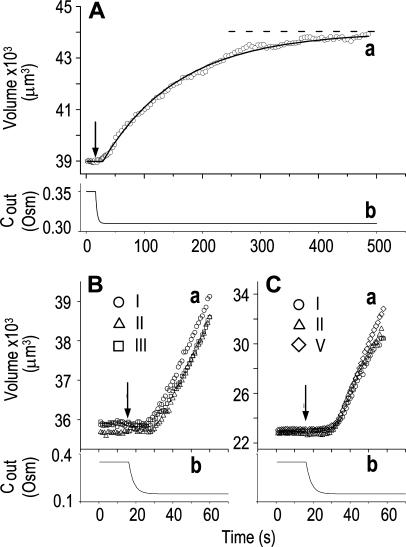
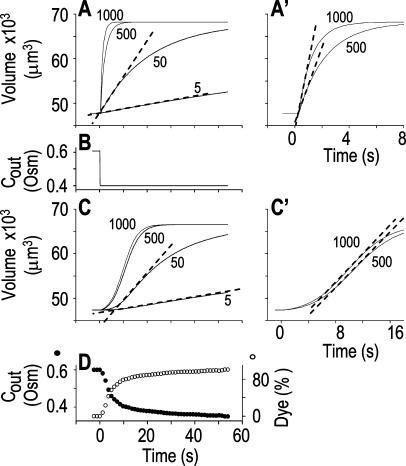
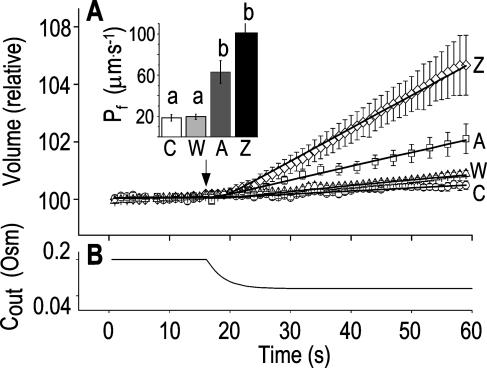
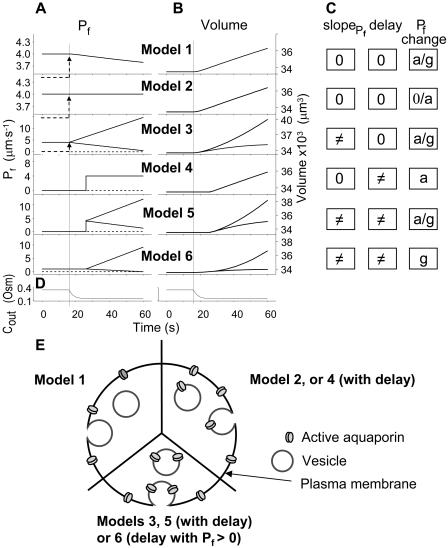
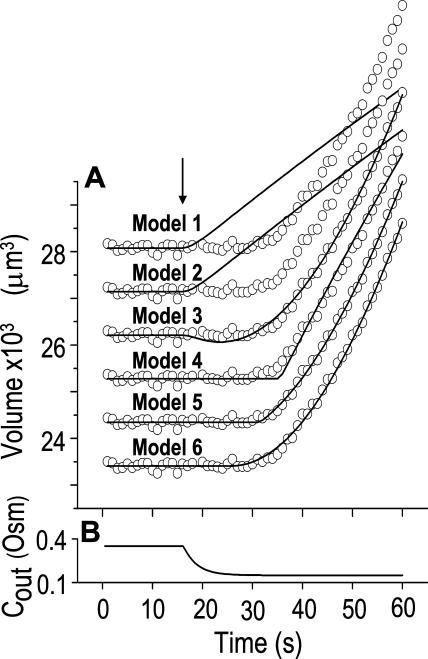
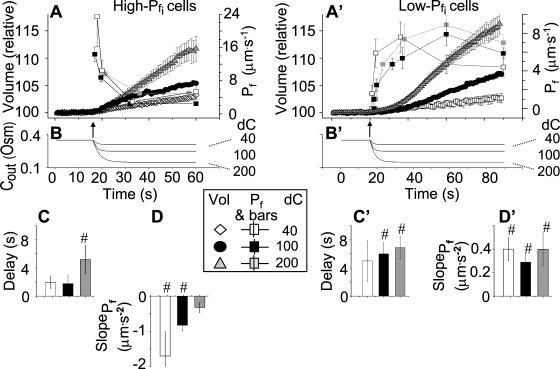
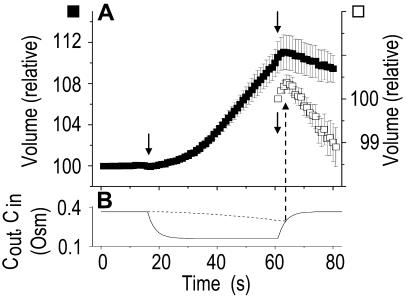
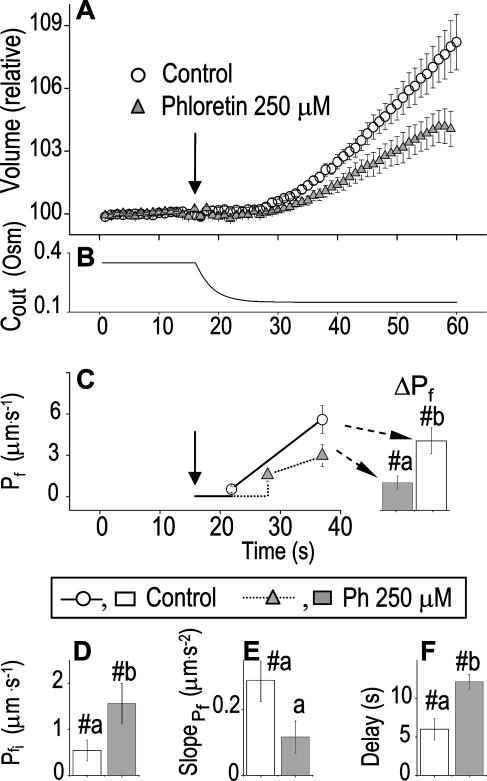
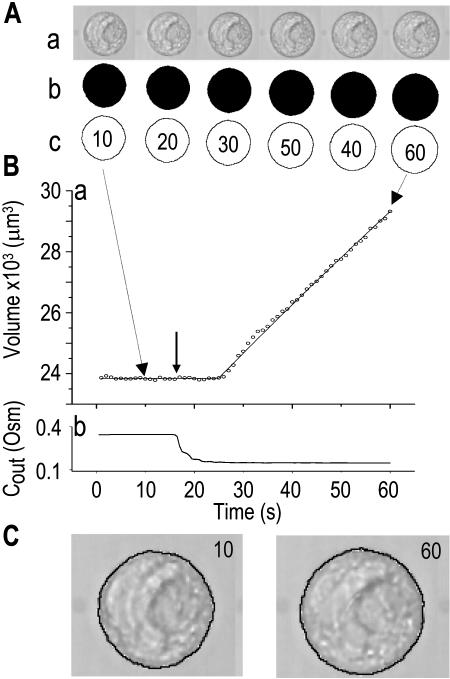
The osmotic water permeability coefficient (P(f)) of plasma membrane of maize (Zea mays) Black Mexican Sweet protoplasts changed dynamically during a hypoosmotic challenge, as revealed using a model-based computational approach. The best-fitting model had three free parameters: initial P(f), P(f) rate-of-change (slope(P(f))), and a delay, which were hypothesized to reflect changes in the number and/or activity of aquaporins in the plasma membrane. Remarkably, the swelling response was delayed 2 to 11 s after start of the noninstantaneous (but accounted for) bath flush. The P(f) during the delay was < or =1 microm s(-1). During the swelling period following the delay, P(f) changed dynamically: within the first 15 s P(f) either (1) increased gradually to approximately 8 microm s(-1) (in the majority population of low-initial-P(f) cells) or (2) increased abruptly to 10 to 20 microm s(-1) and then decreased gradually to 3 to 6 microm s(-1) (in the minority population of high-initial-P(f) cells). We affirmed the validity of our computational approach by the ability to reproduce previously reported initial P(f) values (including the absence of delay) in control experiments on Xenopus oocytes expressing the maize aquaporin ZmPIP2;5. Although mercury did not affect the P(f) in swelling Black Mexican Sweet cells, phloretin, another aquaporin inhibitor, inhibited swelling in a predicted manner, prolonging the delay and slowing P(f) increase, thereby confirming the hypothesis that P(f) dynamics, delay included, reflected the varying activity of aquaporins.


Figures

Figure 1.
Figure 1.
The osmometer properties of swelling protoplasts. A, a, An approximately 8-min-long time course of swelling of a BMS (“Materials and Methods”) protoplast exposed to a change of the bath solution from 350 mOsm to 310 mOsm. Symbols, Experimental values of protoplast volume calculated from the areas of its circular two-dimensional-projection images (initial diameter: 42.1 μm). Line, Protoplast volume calculated using Eq. 2f (Supplemental Appendix I, with Pf = 9.6 μm s−1). A 12.6-s delay relative to the onset of solution exchange has been introduced into the calculation to allow a satisfactory fit of the line to the data. The predicted volume increase was 12.9%, and the observed increase was 12.6%. A, b, Cout during the osmotic challenge, calculated using Eqs. 1a–1d (Supplemental Appendix I, with the following values: twidth = 2.5 s, thalf = −33.1 s, formula image, formula image, and formula image). B, a, An approximately 60-s-long time course of swelling of a BMS protoplast (initial diameter: 40.9 μm) exposed to alternating bath solutions: first to 354 mOsm (isotonic), then to 160 mOsm (hypotonic), then again to 354 mOsm, etc. (only the steady-state volume attained upon the returns to the isotonic solutions is shown, not the time course of shrinking). The Roman numerals denote the order of recorded volume increases corresponding to the order of the hypotonic challenges. Fitting the data, as in A, a, yielded Pf = 7.0 ± 0.1 μm s−1 (mean ± se, n = 3) and delay = 12.2 ± 0.5 s. B, b, The corresponding calculated Cout time course during the swelling episode (Eqs. 1a–1d, with parameter values as in A, b). C, a, A 35.1-μm (diameter) protoplast undergoing similar hypotonic changes as in B. Fitting the data, as in A, a, yielded Pf = 36.2 ± 3.7 μm s−1 (n = 5) and delay = 15.3 ± 1.3 s. C, b, Cout as in A, b. See “Materials and Methods” and Supplemental Appendices I and II for details of calculations and fitting.
Figure 2.
Figure 2.
The resolution limits of estimating formula image manually. A simulation of a 60-s-long time course of swelling of a 22.5-μm (diameter) protoplast (A, A′, C, C′), exposed to a change of the bath solution, Cout, from isotonic (0.6 Osm) to hypotonic (0.4 Osm), during a step exchange (B) and during gradual solution exchange (D). Numbers indicate the values of the initial osmotic water permeability of the membrane, formula image (in μm s−1), used in the simulation of volume changes. The dashed straight lines have been fitted manually (by eye-balling) to the initial, or fastest-rising, part of the curve. The formula image values determined from the slopes of these straight lines using Eq. 2b are listed in Table I. A, A simulation of volume changes (Eq. 2d) based on an instantaneous change of external concentration, as in B. A′, The first 8 s of A, on an expanded time scale. C, A simulation based on a gradually changing external concentration, as in D (Eqs. 1b and 2d). C′, Fragment of C, on an expanded scale. Note the apparent delay in the volume change, ignored in the manual fitting of the initial volume increase. D, The simulated changing osmolarity of the bath solution (Cout, full circles, Eq. 1b, with parameter values as in Fig. 1A, b), calculated from the time course of fluorescence (in relative units) of dilute acridine orange in the incoming solution (Dye, open circles, Eq. 1a). See text and “Materials and Methods” and Supplemental Appendices I and II for the simulations details.
Figure 3.
Figure 3.
“Non-classical” determination of best-fit formula image of oocytes. A, A 60-s-long average time course of swelling of Xenopus oocytes exposed to a change of solutions from 170 to 50 mOsm. Symbols, Volumes (normalized to the baseline volume) determined from control, noninjected oocytes (C; n = 16), water-injected oocytes (W; n = 8), oocytes pretreated with 100 μg/mL amphotericin-B during 10 to 60 min (A; n = 23), and oocytes injected with 50 ng mRNA of the ZmPIP2;5 (Z; n = 10). Lines, Simulations of swelling, calculated using model 5 (Eq. 2d), and the mean best-fit values of parameters obtained by fitting each individual cell's volume increase with this model. Note that the values of formula image and delay in all cases were indistinguishable from zero. Inset, The means (±se) of the individual best-fit values of formula image obtained in the various treatments (denoted by letters as in A). B, Cout during the hypotonic challenge, recontructed using Eq. 1d (with parameter values as in Fig. 1A, b).
Figure 4.
Figure 4.
Models of volume changes upon hypotonic challenges. A, Simulated time course of Pf. Horizontal dashed lines mark null water permeability. Up arrows mark step increase of Pf (an alternative Pf time course, pending on Pf having a zero value prior to the hypotonic challenge). Vertical lines mark the start of bath perfusion. B, Simulated time course of cell volume. Vertical lines as in A. C, A summary of the essential components of the models: formula image (absent: 0, or present: ≠), delay (similarly), formula image change relative to preceding Pf (gradual, g; abrupt, a; absent, 0). D, Simulated time courses of bath osmolarity, Eq. 1b to 1d (with parameter values as in Fig. 1A, b). All simulations employed Eqs. 1b to 1d and 3. Additional equations (all from Supplemental Appendix I) were used as follows: model 1: Eqs. 2d and 4 to 5, formula image; model 2: Eq. 2d, formula image; model 3: Eqs. 2e and 6, formula image, formula image, and formula image, for the upper and lower lines, respectively; model 4: Eqs. 2f and 7; formula image, delay = td = 10 s; model 5: Eqs. 6, 7, and 2g; all parameter values as in models 3 and 4 combined; model 6: Pf during the delay = formula image, formula image, and formula image, for the upper and lower lines, respectively. E, A schematic illustration of some of the modeled vesicular mechanisms of Pf dynamics during the cell swelling phase (not all the options are included). See text for further explanations.
Figure 5.
Figure 5.
Model selection. A, A 60-s-long time course of swelling of a BMS protoplast exposed to a change of solutions from 350 to 150 Osm, fitted repeatedly using different models (Eqs. 2d–2g, Supplemental Appendix I). All but the lowermost data-simulation pairs were shifted vertically upward for clarity. The values of the parameters used for the simulations are listed in Table II. B, Time course of Cout, reconstructed using Eq. 1b (with parameter values as in Fig. 1A, b).
Figure 6.
Figure 6.
Pf dynamics. A and A′, The time courses of volume during hypotonic shock of 40 mOsm, 100 mOsm, and 200 mOsm (means ± se, symbols without connecting lines) were fitted with model 5 (for clarity, omitting data fitted with model 6). The fitted record durations varied between 15 s, 32 s, and 45 s (in record duration we refer strictly to the net duration of the post-delay swelling period; the delay was also included in the fit irrespective of its duration). Pf values were plotted (means ± se, symbols connected by lines) depending on the fitted record duration, as follows: the Pf at the beginning and the end of each delay was plotted at 0 μm s−1 (according to model 5), then the best-fit formula image of the 15-s record was plotted at the end of the best-fit delay, marking a step increase of Pf (see model 5, Fig. 4A). The final (end-of-the-record) Pf values of all records, formula image, were calculated using the corresponding best-fit formula image (Eq. 6, Supplemental Appendix I) and were placed at the time points corresponding to the end of the fitted records (record length of 15 s, 32 s or 45 s + delay; the differences between the horizontal positions of the symbols reflect the different durations of the best-fit delays). The results were grouped, as indicated, into low-formula image cells and high-formula image cells, based on their 15-s record formula image values. B and B′, The corresponding time courses of bath perfusion (Eq. 1b, with the following values: for delC of 200 mOsm: as in Fig. 1A, b; for delC of 100 mOsm: twidth = 2.5 s, thalf = −34.4 s, lag = 1 s, formula image, formula image, and formula image), and for delC of 40 mOsm: twidth = 2.5 s, thalf = −34.4 s, lag = 1 s, formula image, formula image, and formula image). C and C′, The best-fit values of delay extracted from the 15-s-long records (mean ± se), as listed in Supplemental Table II. D and D′, The best-fit values of formula image extracted from the 15-s-long records (mean ± se). #, Significant difference from zero (P < 0.05).
Figure 7.
Figure 7.
Swelling and shrinking compared. A, The averaged traces of the time courses of volume changes: swelling of BMS protoplasts during a hypotonic challenge of a 200 mOsm step, and shrinking upon the restoration of the isotonic solution (approximately 350 mOsm). Full symbols represent volumes normalized to the initial pre-swelling volume at the isotonic solution (mean ± se, n = 27). Down arrows, The onset of bath flush. Open symbols (inset) represent part of the same data—volumes during restoration of the isotonic solution—normalized to the volume just prior to the onset of bath flush. B, The osmolarity of bath solution. Solid line, The simulated time course of bath solution exchange (Eq. 1b, Supplemental Appendix I, and parameter values as in Fig. 1A, b). Dotted line, The simulated time course of intracellular concentration (Eq. 3, Supplemental Appendix I). Up arrow indicates the start of cell shrinking coinciding with the intracellular concentration beginning to exceed the concentration in the bath.
Figure 8.
Figure 8.
The effect of phloretin on the parameters of BMS protoplast swelling. A, A 60-s-long average time course of swelling of BMS protoplasts exposed to a hypotonic challenge of 200 mOsm. Symbols, Relative volumes (% of baseline volume) determined from control protoplasts (n = 8) and protoplasts pretreated for 15 to 30 min with 250 μm phloretin (n = 6). The high-formula image cells, identified during the analyzes of the 15-s-long swelling records using model 5, were excluded from these averages (1 cell from the control group and 2 cells from the phloretin-treated group). B, Cout during the hypotonic challenge, reconstructed using Eq. 1b, with parameter values as follows: twidth = 2.5 s, thalf = −32.37, formula image, formula image, and Cinit= 80,365. C, Pf dynamics during roughly 20 s after beginning of bath flush with the hypotonic solution (down arrows) without and with phloretin treatment, as indicated. The first symbols indicate mean formula imagese), the second, mean formula image, calculated based on formula image and the formula image of each cell. When not seen, se is smaller than the symbol. ΔPf (bars), The increase of Pf during this period, averaged over all the cells. D to F, The mean (±se) values of the best-fit parameters obtained from 15-s-long swelling records without and with phloretin treatment, as indicated. #, Denotes significant difference from zero, and a and b denote significant differences between means (P < 0.05).
Figure 9.
Figure 9.
Image analysis of protoplast swelling. A, a, Exerpts from a time-series (montage) of images of a single swelling protoplast (diam: 35.7 μm) monitored during a approximately 43 s exposure to a hypotonic solution; b, protoplast images converted into shadows, and c, into contours, using the Scion Image program. Note that the measuring procedure required a slight tilt of the shadows matrix. B, Time course of volume changes, calculated from the areas enclosed by the countours, as in A-c, according to simple sphere geometry: Volume = 4/3·π·(cross-sectional area/π)3/2. C, The fidelity of conversion: the extracted contours (A-c) match exactly the contours of protoplasts in the original images. Numbers on images indicate the sequential order of their acquisition. See text for additional details.

References

    1. Alexandre J, Lassalles JP (1991) Hydrostatic and osmotic pressure activated channel in plant vacuole. Biophys J 60: 1326–1336 - PMC - PubMed
    1. Bick I, Thiel G, Homann U (2001) Cytochalasin D attenuates the desensitisation of pressure-stimulated vesicle fusion in guard cell protoplasts. Eur J Cell Biol 80: 521–526 - PubMed
    1. Brown D (2003) The ins and outs of aquaporin-2 trafficking. Am J Physiol Renal Physiol 284: F893–F901 - PubMed
    1. Chaumont F, Barrieu F, Jung R, Chrispeels MJ (2000) Plasma membrane intrinsic proteins from maize cluster in two sequence subgroups with differential aquaporin activity. Plant Physiol 122: 1025–1034 - PMC - PubMed
    1. Cosgrove DJ, Hedrich R (1991) Stretch-activated chloride, potassium, and calcium channels coexisting in plasma membranes of guard cells of Vicia faba L Planta 186: 143–153 - PubMed

Publication types

LinkOut - more resources