. 2004 Aug;135(4):2330-47.
doi: 10.1104/pp.104.044362. Epub 2004 Aug 13.

Transcriptome profiling of the response of Arabidopsis suspension culture cells to Suc starvation

Affiliations

Transcriptome profiling of the response of Arabidopsis suspension culture cells to Suc starvation

Anthony L Contento et al. Plant Physiol. 2004 Aug.

Abstract

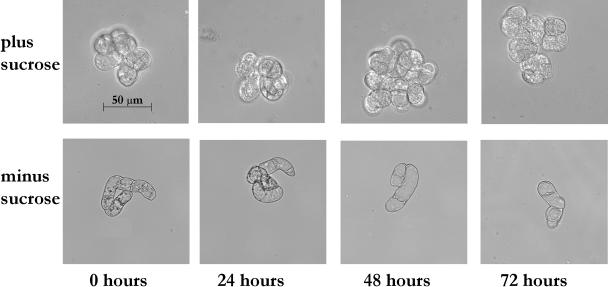
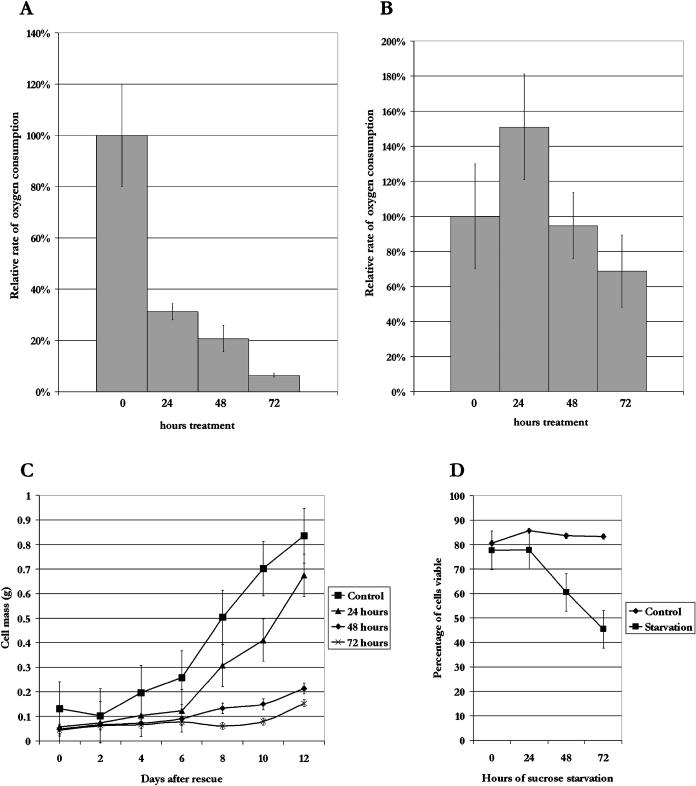
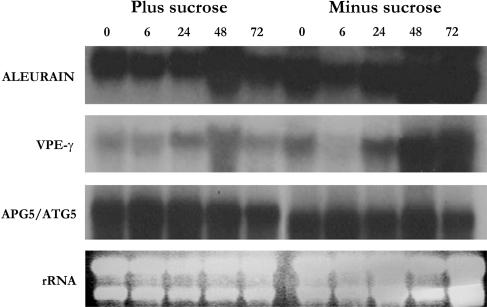
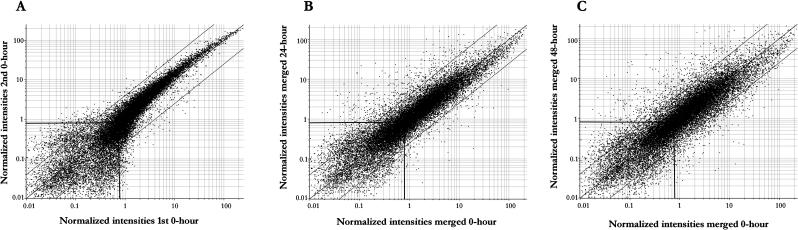
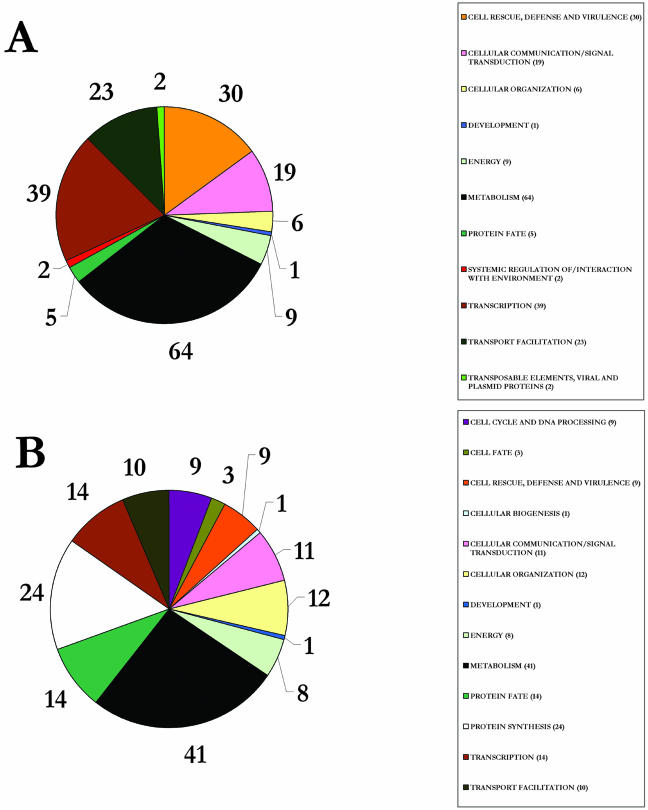
Upon encountering nutrient stress conditions, plant cells undergo extensive metabolic changes and induce nutrient recycling pathways for their continued survival. The role of nutrient mobilization in the response of Arabidopsis suspension cells to Suc starvation was examined. Vacuolar autophagy was induced within 24 h of starvation, with increased expression of vacuolar proteases that are likely to be required for degradation of cytoplasmic components delivered to the vacuole, and thus for nutrient recycling. After 48 h of starvation, culture viability began to decrease, and substantial cell death was evident by 72 h. To provide further insight into the pathways required for survival during Suc deficit, transcriptional profiling during Suc starvation was performed using the ATH1 GeneChip array containing 22,810 probe sets. A significant increase in transcript levels was observed for 343 genes within 48 h of starvation, indicating a response to nutrient stress that utilizes the recycling of cellular components and nutrient scavenging for maintaining cell function, the protection of the cell from death through activation of various defense and stress response pathways, and regulation of these processes by specific protein kinases and transcription factors. These physiological and molecular data support a model in which plant cells initiate a coordinated response of nutrient mobilization at the onset of Suc depletion that is able to maintain cell viability for up to 48 h. After this point, genes potentially involved in cell death increase in expression, whereas those functioning in translation and replication decrease, leading to a decrease in culture viability and activation of cell death programs.


Figures

Figure 1.
Figure 1.
Cellular morphology changes during Suc starvation. Arabidopsis suspension cell cultures were transferred to Suc-free medium and subcellular structure analyzed after 0, 24, 48, and 72 h, compared with control cultures. Scale bar is equal to 50 μm.
Figure 2.
Figure 2.
Analysis of oxygen consumption and culture viability during Suc starvation. Suspension cultures were grown with or without Suc for 0, 24, 48, or 72 h. The rate of respiration per gram of cells was determined for starved cells (A) and for control cells (B). Oxygen consumption rate is represented as a percentage of the 0-h control sample. C, Suspension cultures were starved of Suc for 0, 24, 48, or 72 h, after which they were rescued by replacing the starvation medium with Suc-containing medium. Samples (5 mL) were taken every 48 h after rescue for 12 d and the fresh weight of cells was measured for each sample. D, Suspension cell cultures were starved for 3 d, with 5-mL samples taken every 24 h. The cells were stained with fluorescein diacetate and viewed under a UV fluorescence microscope to determine the percentage of viable cells. Error bars indicate se.
Figure 3.
Figure 3.
Transcript levels of vacuolar enzymes increase during Suc starvation. Total RNA was extracted from suspension cells after 0, 6, 24, 48, or 72 h of Suc starvation, or control cells grown in the presence of Suc. RNA gel blots were probed with labeled cDNAs for the vacuole-specific proteases aleurain (AALP; At5g60360) and VPE-γ (At4g32940). An APG5/ATG5 (At5g17290) probe and ethidium bromide-stained rRNA were used as controls for equal loading.
Figure 4.
Figure 4.
Scatter plots of Arabidopsis ATH1 GeneChip data. Normalized signal intensities are plotted, with guide lines on each graph representing a fourfold change, increasing or decreasing in signal, and indicating a signal intensity of 0.8, used as the lower limit of detection. A, Two biological replicates are compared for the 0-h time point. B, Comparison of 0- and 24-h starvation samples. C, Comparison of 0- and 48-h starvation samples. For B and C, signal intensities are the average of two biological replicates.
Figure 5.
Figure 5.
Functional categories of genes. Each gene was assigned a functional category based on the known or putative function of its protein, according to the Munich Information Center for Protein Sequencing Functional Category database. Pie charts show the number of probe sets identified in each category that show at least a 4-fold increase (A) or decrease (B) in transcript level during starvation. Those categorized as unclassified, 143 probe sets for A and 104 probe sets for B, are excluded from the pie charts for clarity.
Figure 6.
Figure 6.
Genes encoding trehalose metabolic enzymes change in expression during starvation. The fold change in transcript level of TPS (A) and TPP (B) genes after 24 h (gray bars) and 48 h (white bars) was calculated from the mean intensities of two sets of biological replicates. Error bars indicate se. The scale is logarithmic.
Figure 7.
Figure 7.
Changes in transcript levels of putative APG8/ATG8 genes in Arabidopsis suspension cells during Suc starvation. The fold change in transcript level after 24 h (gray bars) and 48 h (white bars) was calculated from the mean intensities of two sets of biological replicates. Error bars indicate se. The scale is logarithmic.
Figure 8.
Figure 8.
Expression patterns observed over a 48-h Suc starvation time course. Three distinct patterns of gene expression were identified in the subset of genes that were up-regulated by Suc starvation, illustrated by plotting relative signal intensity for 0-h control and 24- and 48-h Suc starvation samples. A, A significant increase in signal intensity from 24 to 48 h is observed. This pattern correlates with k-means cluster group 1. B, A decrease in relative signal intensity is seen between the 24- and 48-h starvation samples. This pattern correlates with k-means cluster group 2. C, No significant change in signal intensities is seen between the 24- and 48-h starvation samples. This pattern correlates with k-means cluster group 3.
Figure 9.
Figure 9.
Verification of GeneChip expression data by RNA blot analysis and RT-PCR. Total RNA from Arabidopsis suspension cell cultures after 24- and 48-h Suc starvation (24 and 48), and 0- and 48-h nonstarved controls (0+ and 48+) was used for RNA blot hybridizations (A) and for RT-PCR reactions (B) for eight genes identified by the GeneChip analysis as induced during starvation. The genes chosen were: At1g13260 (RAV1), a DNA-binding protein; At1g20620 (CAT3), catalase-3; At1g21920 (PI4P5K), a phosphoinositol-4-phosphate-5-kinase; At1g78290 (STPK), a Ser/Thr kinase; At2g33830 (AUX), a putative auxin-regulated protein kinase; At4g36670 (SUG), a sugar transporter; At5g10030 (OBF4), a bZIP transcription factor; and At5g61590 (ERF5), an ethylene-responsive element-binding factor. The Arabidopsis APG5/ATG5 gene (At5g17290) was used as a loading control in both experiments.

Similar articles

Cited by

References

    1. Ahmed SU, Rojo E, Kovaleva V, Venkataraman S, Dombrowski JE, Matsuoka K, Raikhel NV (2000) The plant vacuolar sorting receptor AtELP is involved in transport of NH2-terminal propeptide-containing vacuolar proteins in Arabidopsis thaliana. J Cell Biol 149: 1335–1344 - PMC - PubMed
    1. Aubert S, Gout E, Bligny R, Marty-Mazars D, Barrieu F, Alabouvette J, Marty F, Douce R (1996) Ultrastructural and biochemical characterization of autophagy in higher plant cells subjected to carbon deprivation: control by the supply of mitochondria with respiratory substrates. J Cell Biol 133: 1251–1263 - PMC - PubMed
    1. Barbet NC, Schneider U, Helliwell SB, Stansfield I, Tuite MF, Hall MN (1996) TOR controls translation initiation and early G1 progression in yeast. Mol Biol Cell 7: 25–42 - PMC - PubMed
    1. Bassham DC (2002) Golgi-independent trafficking of macromolecules to the plant vacuole. Adv Bot Res 38: 65–92
    1. Bewley JD (1997) Seed germination and dormancy. Plant Cell 9: 1055–1066 - PMC - PubMed

Publication types

LinkOut - more resources