. 2004 Aug 24;101(34):12700-5.
doi: 10.1073/pnas.0405065101. Epub 2004 Aug 13.

Regional glucose metabolism and glutamatergic neurotransmission in rat brain in vivo

Affiliations

Regional glucose metabolism and glutamatergic neurotransmission in rat brain in vivo

Robin A de Graaf et al. Proc Natl Acad Sci U S A. .

Abstract

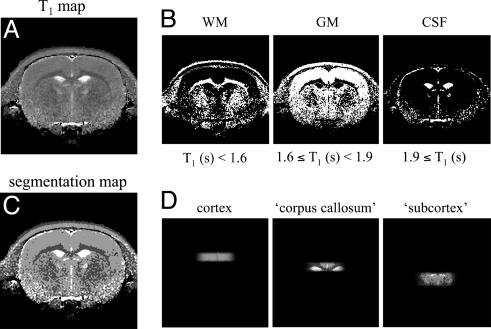
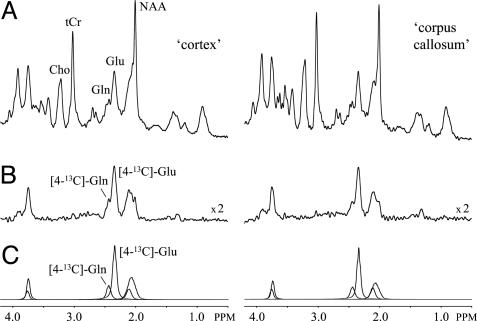
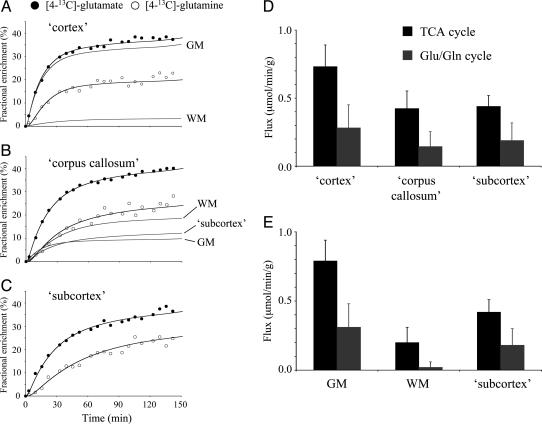
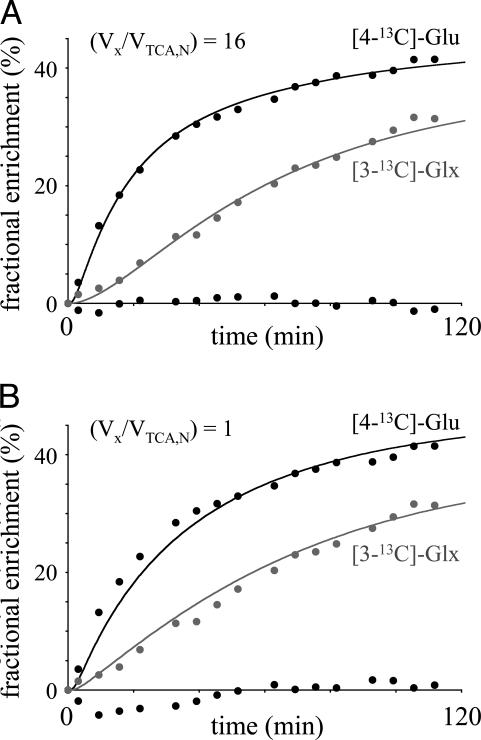
Multivolume (1)H-[(13)C] NMR spectroscopy in combination with i.v. [1,6-(13)C(2)]glucose infusion was used to detect regional glucose metabolism and glutamatergic neurotransmission in the halothane-anesthetized rat brain at 7 T. The regional information was decomposed into pure cerebral gray matter, white matter, and subcortical structures by means of tissue segmentation based on quantitative T(1) relaxation mapping. The (13)C turnover curves of [4-(13)C]glutamate, [4-(13)C]glutamine, and [3-(13)C]glutamate + glutamine were fitted with a two-compartment neuronal-astroglial metabolic model. The neuronal tricarboxylic acid cycle fluxes in cerebral gray matter, white matter, and subcortex were 0.79 +/- 0.15, 0.20 +/- 0.11, and 0.42 +/- 0.09 micromol/min per g, respectively. The glutamate-glutamine neurotransmitter cycle fluxes in cerebral gray matter, white matter, and subcortex were 0.31 +/- 0.07, 0.02 +/- 0.04, and 0.18 +/- 0.12 micromol/min per g, respectively. The exchange rate between the mitochondrial and cytosolic metabolite pools was fast relative to the neuronal tricarboxylic acid cycle flux for all cerebral tissue types.


Figures

Fig. 1.
Fig. 1.
Procedure for the generation of T1-relaxation-based segmentation maps of rat brain. (A) A quantitative T1 relaxation map, which was generated from multiple T1-weighted MR images after a nonselective inversion pulse. See Introduction for more details. (B) By using the indicated T1 relaxation constant boundaries, the T1 map of (A) can be segmented into white matter (WM), gray matter (GM), and CSF. The WM map also contains noncerebral tissue such as muscle, skull, and fat. (C) The combined segmentation maps of (B) can be overlaid on the experimentally measured sensitivity profile of the three Hadamard-encoded volumes to obtain the exact tissue composition within each volume (D).
Fig. 2.
Fig. 2.
1H and 1H-[13C] NMR spectra from rat brain in vivo. Representative 1H (A) and 1H-[13C] (B) NMR spectra from 25-μl volumes encompassing cerebral cortex (Left) and corpus callosum (Right) are shown. The NMR spectra are acquired between 95 and 120 min after the start of [1,6-13C2]glucose infusion. By using quantitative tissue segmentation as outlined in Fig. 1, the volumes can be decomposed into 92% GM and 8% WM for the cortex volume and 23% GM, 47% WM, and 30% subcortex for the corpus callosum volume. The excellent spectral resolution at 7.05 T readily allows the separate detection of [4-13C]Glu and [4-13C]Gln, as can also be seen from the glutamate and glutamine contributions to the best lcmodel fits shown in C. 1H and 1H-[13C] NMR spectra of similar quality were obtained for the subcortex volume (data not shown).
Fig. 3.
Fig. 3.
Multicompartment metabolic modeling to obtain regional metabolic fluxes in the presence of partial-volume effects. (A-C) [4-13C]Glu and [4-13C]Gln turnover in volumes encompassing mainly cerebral cortex (A), corpus callosum with contributions from cerebral cortex and subcortex (B), and subcortex (C). The black filled lines are the best fits to the data obtained by using a two-compartment metabolic model. The inclusion or exclusion of tissue heterogeneity has no appreciable effect on the goodness-of-fit. The gray filled lines are the contributions of GM, WM, and subcortex to the overall turnover curves when tissue heterogeneity is included in the metabolic modeling. [3-13C]Glx turnover curves are not shown but were included in the metabolic modeling. Metabolic rates for the TCA cycle (black) and Glu/Gln neurotransmitter cycle (gray) when ignoring tissue heterogeneity (i.e., one macroscopic compartment) (D) or considering tissue heterogeneity through quantitative tissue segmentation (i.e., three macroscopic compartments) (E). See Methods and Results for more details.
Fig. 4.
Fig. 4.
Evaluating the effect of the 2-OG/Glu exchange rate Vx on the goodness-of-fit of the [4-13C]Glu and [3-13C]Glx turnover curves from a volume combining all tissues. (A) When Vx is fast relative to VTCA, the quality of the fit is excellent, as can also be judged from the residual between the experimental and fitted [4-13C]Glu turnover curves (randomly scattered round a fractional enrichment of 0%). For a Vx-to-VTCA ratio of 1, the initial data points of the [4-13C]Glu turnover curve are clearly underestimated, and the overall quality of the fit, as can be judged from the residual χ2, is roughly twice that of A. Extensive simulations demonstrate that the goodness-of-fit (residual χ2) does not improve any further for Vx > 10 × VTCA. Monte Carlo simulations give Vx = 8.2 ± 4.3 μmol/min per g with 95% confidence intervals of 1.7-22.5 μmol/min per g.

References

    1. Shen, J., Petersen, K. F., Behar, K. L., Brown, P., Nixon, T. W., Mason, G. F., Petroff, O. A. C., Shulman, G. I., Shulman, R. G. & Rothman, D. L. (1999) Proc. Natl. Acad. Sci. USA 96, 8235-8240. - PMC - PubMed
    1. Gruetter, R., Seaquist, E. R. & Ugurbil, K. (2001) Am. J. Physiol. 281, E100-E112. - PubMed
    1. Chhina, N., Kuestermann, E., Halliday, J., Simpson, L. J., Macdonald, I. A., Bachelard, H. S. & Morris, P. G. (2001) J. Neurosci. Res. 66, 737-746. - PubMed
    1. Sibson, N. R., Dhankhar, A., Mason, G. F., Behar, K. L., Rothman, D. L. & Shulman, R. G. (1997) Proc. Natl. Acad. Sci. USA 94, 2699-2704. - PMC - PubMed
    1. Sibson, N. R., Dhankhar, A., Mason, G. F., Rothman, D. L., Behar, K. L. & Shulman, R. G. (1998) Proc. Natl. Acad. Sci. USA 95, 316-321. - PMC - PubMed

Publication types

LinkOut - more resources