

Monocytosis and accelerated activation of lymphocytes in C1q-deficient autoimmune-prone mice
- PMID: 15312138
- PMCID: PMC1782548
- DOI: 10.1111/j.1365-2567.2004.01940.x
Monocytosis and accelerated activation of lymphocytes in C1q-deficient autoimmune-prone mice
Abstract
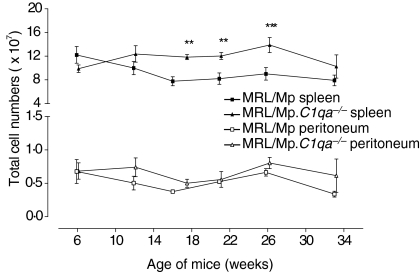
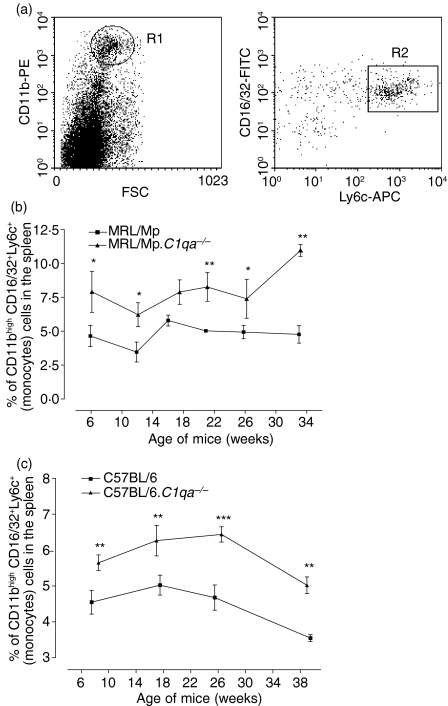
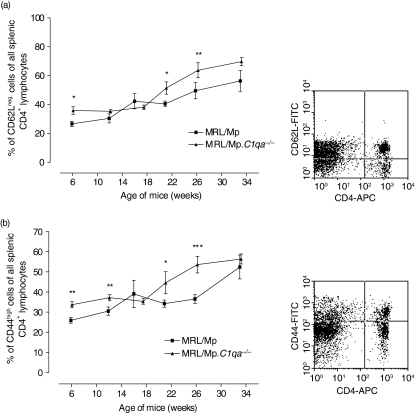
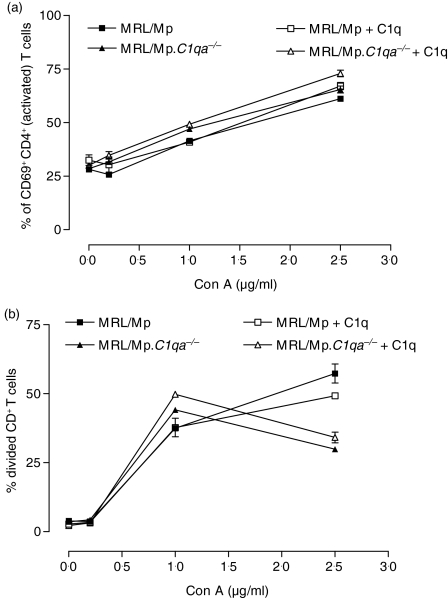
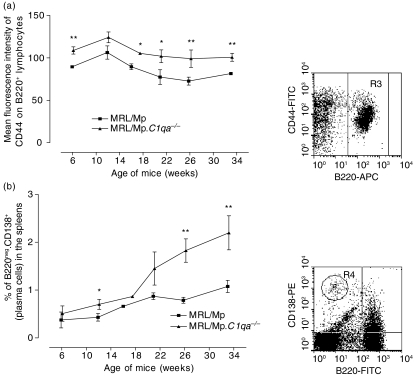
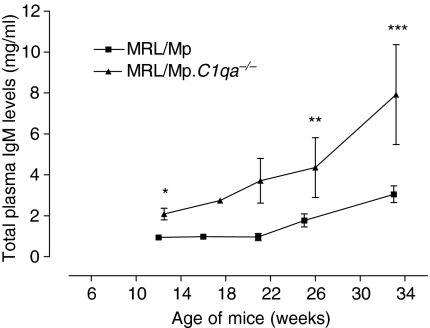
C1q deficiency has been shown to accelerate spontaneous autoimmunity in mice. We studied the time course of activation of monocytes and lymphocytes in autoimmune and non-autoimmune mice in the presence or absence of C1q as a disease accelerator. Autoimmune MRL\Mp.C1qa-\- and non-autoimmune C57BL\6.C1qa-\- mice were analysed at various time points between 6 and 33 weeks of age and compared to strain- and age-matched C1q-sufficient controls. Splenic and peritoneal leucocytes were analysed by flow cytometry and plasma levels of immunoglobulin M (IgM), total IgG, IgG subclasses and IgM autoantibodies were measured. Both C1q-deficient strains had significantly more splenic monocytes than their controls at all time points analysed. In addition, MRL\Mp.C1qa-\- but not C57BL/6.C1qa-\- mice developed splenic hypercellularity starting at about 12-17 weeks old, had signs of accelerated CD4+ T-cell activation and showed a marked increase in splenic plasma cells and total serum IgM levels from about 22 weeks of age. The accelerated CD4+ T-cell activation was not due to a direct inhibitory effect of C1q on T cells. These data show that C1q deficiency causes splenic monocytosis together with accelerated T-cell activation in an autoimmune-prone mouse strain.
Figures
Similar articles
-
Restoration of C1q levels by bone marrow transplantation attenuates autoimmune disease associated with C1q deficiency in mice.Eur J Immunol. 2004 Dec;34(12):3713-22. doi: 10.1002/eji.200425616. Eur J Immunol. 2004. PMID: 15517607
-
Cell cycle analysis of lymphocyte activation in normal and autoimmune strains of mice.J Immunol. 1982 Sep;129(3):1219-26. J Immunol. 1982. PMID: 6125541
-
Introduction of an osteopontin gene confers the increase in B1 cell population and the production of anti-DNA autoantibodies.Lab Invest. 1998 Dec;78(12):1523-33. Lab Invest. 1998. PMID: 9881952
-
Role of B-1a cells in autoimmunity.Autoimmun Rev. 2006 Jul;5(6):403-8. doi: 10.1016/j.autrev.2005.10.007. Epub 2005 Dec 9. Autoimmun Rev. 2006. PMID: 16890894 Review.
-
C1q knock-out mice for the study of complement deficiency in autoimmune disease.Exp Clin Immunogenet. 1998;15(4):231-4. doi: 10.1159/000019076. Exp Clin Immunogenet. 1998. PMID: 10072632 Review.
Cited by
-
Anti-C1q autoantibodies from systemic lupus erythematosus patients enhance CD40-CD154-mediated inflammation in peripheral blood mononuclear cells in vitro.Clin Transl Immunology. 2022 Aug 2;11(8):e1408. doi: 10.1002/cti2.1408. eCollection 2022. Clin Transl Immunology. 2022. PMID: 35928801 Free PMC article.
-
C1q as a target molecule to treat human disease: What do mouse studies teach us?Front Immunol. 2022 Aug 3;13:958273. doi: 10.3389/fimmu.2022.958273. eCollection 2022. Front Immunol. 2022. PMID: 35990646 Free PMC article.
-
Genetic and Molecular Basis of QTL of Diabetes in Mouse: Genes and Polymorphisms.Curr Genomics. 2008;9(5):324-37. doi: 10.2174/138920208785133253. Curr Genomics. 2008. PMID: 19471607 Free PMC article.
-
Novel collectin/C1q receptor mediates mast cell activation and innate immunity.Blood. 2006 Jan 1;107(1):143-50. doi: 10.1182/blood-2005-06-2218. Epub 2005 Sep 15. Blood. 2006. PMID: 16166590 Free PMC article.
-
Deficiency in complement C1q improves histological and functional locomotor outcome after spinal cord injury.J Neurosci. 2008 Dec 17;28(51):13876-88. doi: 10.1523/JNEUROSCI.2823-08.2008. J Neurosci. 2008. PMID: 19091977 Free PMC article.
References
-
- Pickering MC, Botto M, Taylor PR, Lachmann PJ, Walport MJ. Systemic lupus erythematosus, complement deficiency, and apoptosis. Adv Immunol. 2000;76:227–324. - PubMed
-
- Carroll MC. The role of complement in B cell activation and tolerance. Adv Immunol. 2000;74:61–88. - PubMed
-
- Prodeus AP, Goerg S, Shen LM, Pozdnyakova OO, Chu L, Alicot EM, Goodnow CC, Carroll MC. A critical role for complement in maintenance of self-tolerance. Immunity. 1998;9:721–31. - PubMed
-
- Cutler AJ, Cornall RJ, Ferry H, Manderson AP, Botto M, Walport MJ. Intact B cell tolerance in the absence of the first component of the classical complement pathway. Eur J Immunol. 2001;31:2087–93. - PubMed
-
- Walport MJ, Davies KA, Botto M. C1q and systemic lupus erythematosus. Immunobiology. 1998;199:265–85. - PubMed
Publication types
MeSH terms
Substances
LinkOut - more resources
Full Text Sources
Medical
Molecular Biology Databases
Research Materials
Miscellaneous