Immune regulatory effect of pHSP65 DNA therapy in pulmonary tuberculosis: activation of CD8+ cells, interferon-gamma recovery and reduction of lung injury
- PMID: 15312144
- PMCID: PMC1782550
- DOI: 10.1111/j.1365-2567.2004.01931.x
Immune regulatory effect of pHSP65 DNA therapy in pulmonary tuberculosis: activation of CD8+ cells, interferon-gamma recovery and reduction of lung injury
Abstract
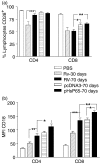
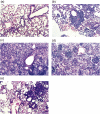
A DNA vaccine based on the heat-shock protein 65 Mycobacterium leprae gene (pHSP65) presented a prophylactic and therapeutic effect in an experimental model of tuberculosis. In this paper, we addressed the question of which protective mechanisms are activated in Mycobacterium tuberculosis-infected mice after immune therapy with pHSP65. We evaluated activation of the cellular immune response in the lungs of infected mice 30 days after infection (initiation of immune therapy) and in those of uninfected mice. After 70 days (end of immune therapy), the immune responses of infected untreated mice, infected pHSP65-treated mice and infected pCDNA3-treated mice were also evaluated. Our results show that the most significant effect of pHSP65 was the stimulation of CD8+ lung cell activation, interferon-gamma recovery and reduction of lung injury. There was also partial restoration of the production of tumour necrosis factor-alpha. Treatment with pcDNA3 vector also induced an immune stimulatory effect. However, only infected pHSP65-treated mice were able to produce significant levels of interferon-gamma and to restrict the growth of bacilli.
Figures


Similar articles
-
Therapeutic efficacy of a tuberculosis DNA vaccine encoding heat shock protein 65 of Mycobacterium tuberculosis and the human interleukin 2 fusion gene.Tuberculosis (Edinb). 2009 Jan;89(1):54-61. doi: 10.1016/j.tube.2008.09.005. Epub 2008 Dec 3. Tuberculosis (Edinb). 2009. PMID: 19056317
-
Improved cellular immune response elicited by a ubiquitin-fused ESAT-6 DNA vaccine against Mycobacterium tuberculosis.Microbiol Immunol. 2009 Jul;53(7):384-90. doi: 10.1111/j.1348-0421.2009.00138.x. Microbiol Immunol. 2009. PMID: 19563397
-
Comprehensive gene expression profiling in lungs of mice infected with Mycobacterium tuberculosis following DNAhsp65 immunotherapy.J Gene Med. 2009 Jan;11(1):66-78. doi: 10.1002/jgm.1269. J Gene Med. 2009. PMID: 19035575
-
DNA vaccine using hemagglutinating virus of Japan-liposome encapsulating combination encoding mycobacterial heat shock protein 65 and interleukin-12 confers protection against Mycobacterium tuberculosis by T cell activation.Vaccine. 2006 Feb 20;24(8):1191-204. doi: 10.1016/j.vaccine.2005.08.103. Epub 2005 Sep 19. Vaccine. 2006. PMID: 16216394
-
[Novel vaccines against M. tuberculosis].Kekkaku. 2006 Dec;81(12):745-51. Kekkaku. 2006. PMID: 17240920 Review. Japanese.
Cited by
-
Dietary restriction abrogates antibody production induced by a DNA vaccine encoding the mycobacterial 65 kDa heat shock protein.Genet Vaccines Ther. 2009 Jul 16;7:11. doi: 10.1186/1479-0556-7-11. Genet Vaccines Ther. 2009. PMID: 19607696 Free PMC article.
-
Protection conferred by heterologous vaccination against tuberculosis is dependent on the ratio of CD4(+) /CD4(+) Foxp3(+) cells.Immunology. 2012 Nov;137(3):239-48. doi: 10.1111/imm.12006. Immunology. 2012. PMID: 22891805 Free PMC article.
-
Helminth coinfection does not affect therapeutic effect of a DNA vaccine in mice harboring tuberculosis.PLoS Negl Trop Dis. 2010 Jun 8;4(6):e700. doi: 10.1371/journal.pntd.0000700. PLoS Negl Trop Dis. 2010. PMID: 20544012 Free PMC article.
-
Corrected and Republished from: "A Novel, Multiple-Antigen Pneumococcal Vaccine Protects against Lethal Streptococcus pneumoniae Challenge".Infect Immun. 2022 Jan 25;90(1):e0084618a. doi: 10.1128/IAI.00846-18a. Epub 2018 Dec 10. Infect Immun. 2022. PMID: 35076289 Free PMC article.
-
Complexity and Controversies over the Cytokine Profiles of T Helper Cell Subpopulations in Tuberculosis.J Immunol Res. 2015;2015:639107. doi: 10.1155/2015/639107. Epub 2015 Oct 1. J Immunol Res. 2015. PMID: 26495323 Free PMC article. Review.
References
-
- Raviglione MC. The TB epidemic from 1992 to 2002. Tuberculosis. 2002;83:4–14. - PubMed
-
- Godfrey-Faussett P, Ayles H. Can we control tuberculosis in high HIV prevalence settings? Tuberculosis. 2003;83:68–76. - PubMed
-
- Smith D. Protective efficacy of BCG in experimental tuberculosis. Adv Tuberc Res. 1995;22:1–97. - PubMed
-
- Fine PE. The BCG story. Lessons from the past and implications for the future. Rev Infect Dis Supplement. 1989;2:S353–9. - PubMed
Publication types
MeSH terms
Substances
LinkOut - more resources
Full Text Sources
Other Literature Sources
Research Materials
