Comparative Study
. 2004 Aug;8(4):R234-42.
doi: 10.1186/cc2877. Epub 2004 Jun 10.

Procalcitonin and C-reactive protein during systemic inflammatory response syndrome, sepsis and organ dysfunction

Affiliations
Comparative Study

Procalcitonin and C-reactive protein during systemic inflammatory response syndrome, sepsis and organ dysfunction

Gian Paolo Castelli et al. Crit Care. 2004 Aug.

Abstract

Introduction: Both C-reactive protein (CRP) and procalcitonin (PCT) are accepted sepsis markers. However, there is still some debate concerning the correlation between their serum concentrations and sepsis severity. We hypothesised that PCT and CRP concentrations are different in patients with infection or with no infection at a similar severity of organ dysfunction or of systemic inflammatory response.

Patients and methods: One hundred and fifty adult intensive care unit patients were observed consecutively over a period of 10 days. PCT, CRP and infection parameters were compared among the following groups: no systemic inflammatory response syndrome (SIRS) (n = 15), SIRS (n = 15), sepsis/SS (n = 71) (including sepsis, severe sepsis and septic shock [n = 34, n = 22 and n = 15]), and trauma patients (n = 49, no infection).

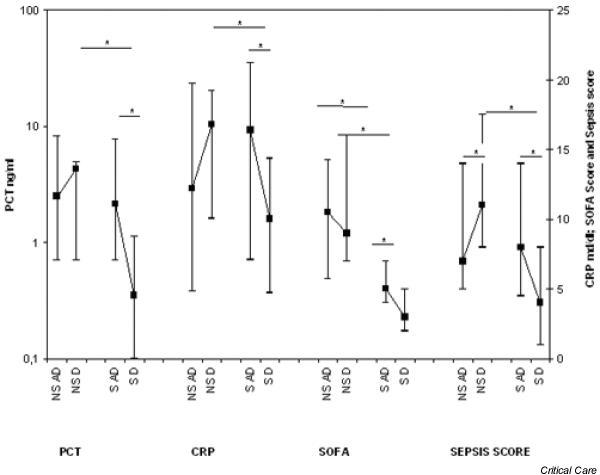
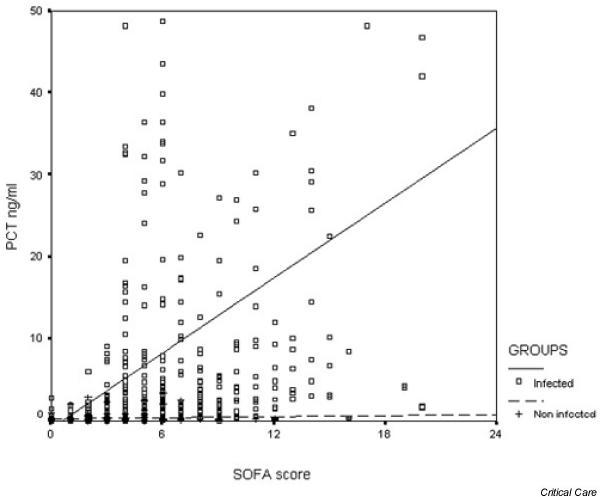
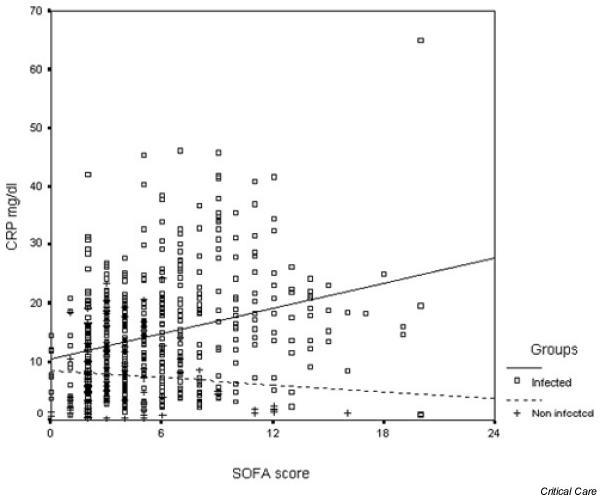
Results: PCT and CRP concentrations were higher in patients in whom infection was diagnosed at comparable levels of organ dysfunction (infected patients, regression of median [ng/ml] PCT = -0.848 + 1.526 sequential organ failure assessment [SOFA] score, median [mg/l] CRP = 105.58 + 0.72 SOFA score; non-infected patients, PCT = 0.27 + 0.02 SOFA score, P < 0.0001; CRP = 84.53 - 0.19 SOFA score, P < 0.005), although correlation with the SOFA score was weak (R = 0.254, P < 0.001 for PCT, and R = 0.292, P < 0.001 for CRP). CRP levels were near their maximum already during lower SOFA scores, whereas maximum PCT concentrations were found at higher score levels (SOFA score > 12).PCT and CRP concentrations were 1.58 ng/ml and 150 mg/l in patients with sepsis, 0.38 ng/ml and 51 mg/l in the SIRS patients (P < 0.05, Mann-Whitney U-test), and 0.14 ng/ml and 72 mg/l in the patients with no SIRS (P < 0.05). The kinetics of both parameters were also different, and PCT concentrations reacted more quickly than CRP.

Conclusions: PCT and CRP levels are related to the severity of organ dysfunction, but concentrations are still higher during infection. Different sensitivities and kinetics indicate a different clinical use for both parameters.


Figures

Figure 1
Figure 1
Receiver operating characteristic (ROC) curves (95% confidence interval) for the prediction of sepsis versus systemic inflammatory response syndrome. C-reactive protein (CRP) (thin dashed line), 0.794 (0.644–0.944) (standard error, 0.05; P < 0.05); best cut-off, 90 mg/l; sensitivity, specificity, negative predictive value (NPV), and positive predictive value (PPV), 74, 85, 92, and 53. Procalcitonin (PCT) (thick solid line), 0.731 (0.587–0.875) (standard error, 0.05; P < 0.05); best cut-off, 1.2 ng/ml; sensitivity, specificity, NPV, and PPV, 63, 87, 92, and 51. Sepsis score (thin solid line), 0.701 (0.534–0.869) (standard error, 0.08; P = 0.055). Sequential organ failure assessment score (thick dashed line), 0.505 (0.299–0.711) (standard error, 0.105; P = 0.96).
Figure 2
Figure 2
Receiver operating characteristic (ROC) curves (95% confidence interval) for the prediction of sepsis/SS; the trauma group was excluded (diagnosis at admission was obvious). Procalcitonin (PCT) (thick solid line), 0.866 (0.79–0.93) (standard error, 0.04; P < 0.001); best cut-off, 1.11 ng/ml; sensitivity, specificity, negative predictive value (NPV), and positive predictive value (PPV), 79, 85, 92, and 65. Sepsis score (thin dashed line), 0.862 (0.78–0.93) (standard error, 0.04; P < 0.001); best cut-off, 5.5; sensitivity, specificity, NPV, and PPV, 66, 71, 66, and 71. C-reactive protein (CRP) (thin solid line), 0.755 (0.64–0.86) (standard error, 0.05; P < 0.001); best cut-off, 128 mg/l; sensitivity, specificity, NPV, and PPV, 67, 82, 90, and 51. Sequential organ failure assessment (SOFA) score (thick dashed line), 0.731 (0.61–0.84) (standard error, 0.06; P < 0.001); best cut-off, 4.5; sensitivity, specificity, NPV, and PPV, 73, 68, 86, and 47.
Figure 3
Figure 3
Median serum procalcitonin (PCT, ng/ml), C-reactive protein (CRP, mg/dl), sequential organ failure assessment (SOFA) score and sepsis score (score values) time course in sepsis (34 patients). Six nonsurvivors: one in T2, one in T5, one in T6, and three in T8-T9. ■, PCT; □, CRP; ●, sepsis score; ○ SOFA score.
Figure 4
Figure 4
Sepsis/SS group: median and 25th/75th percentiles of procalcitonin (PCT), C-reactive protein (CRP), sequential organ failure assessment (SOFA) score and sepsis score in nonsurvivors (NS) and survivors (S) at admission (AD) and discharge (D). * P < 0.05.
Figure 5
Figure 5
Procalcitonin (PCT)–sequential organ failure assessment (SOFA) correlation in infected patients (PCT = -0.84 + 1.526 × SOFA score, ng/ml) and noninfected patients (PCT = 0.27 + 0.02 × SOFA score, ng/ml). * P < 0.02. □ and solid line, infected and regression line; + and dashed line, noninfected and regression line.
Figure 6
Figure 6
C-reactive protein (CRP)–sequential organ failure assessment (SOFA) correlation in infected patients (CRP = 105.58 + 0.72 × SOFA score, mg/l) and noninfected patients (CRP = 84.53 - 0.19 × SOFA, mg/l). Data presented in mg/dl. * P < 0.001. □ and solid line, infected and regression line; + and dashed line, noninfected and regression line.

Similar articles

Cited by

References

    1. Yentis SM, Soni N, Sheldon J. C-reactive protein as an indicator of resolution of sepsis in the intensive care unit. Intensive Care Med. 1995;21:602–605. - PubMed
    1. Matson A, Soni N, Sheldon J. C-reactive protein as a diagnostic test of sepsis in the critically ill. Anaesth Intensive Care. 1991;19:182–186. - PubMed
    1. Assicot M, Gendrel D, Carsin H, Raymond J, Guilbaud J, Bohoun C. High serum procalcitonin concentrations in patients with sepsis and infection. Lancet. 1993;341:515–518. doi: 10.1016/0140-6736(93)90277-N. - DOI - PMC - PubMed
    1. Al-Nawas B, Krammer I, Shah PM. Procalcitonin in diagnosis of severe infections. Eur J Med Res. 1996;1:331–333. - PubMed
    1. Gramm HJ, Beier W, Zimmermann J, Oedra N, Hannemann L, Boese-Landgraf J. Procalcitonin (ProCT) – a biological marker of the inflammatory response with prognostic properties. Clin Intensive Care. 1995;[Abstract] 6(Suppl 2):71.

Publication types

MeSH terms