. 2004 Aug 16;166(4):527-36.
doi: 10.1083/jcb.200403102.

In vivo monitoring of Ca(2+) uptake into mitochondria of mouse skeletal muscle during contraction

Affiliations

In vivo monitoring of Ca(2+) uptake into mitochondria of mouse skeletal muscle during contraction

Rüdiger Rudolf et al. J Cell Biol. .

Abstract

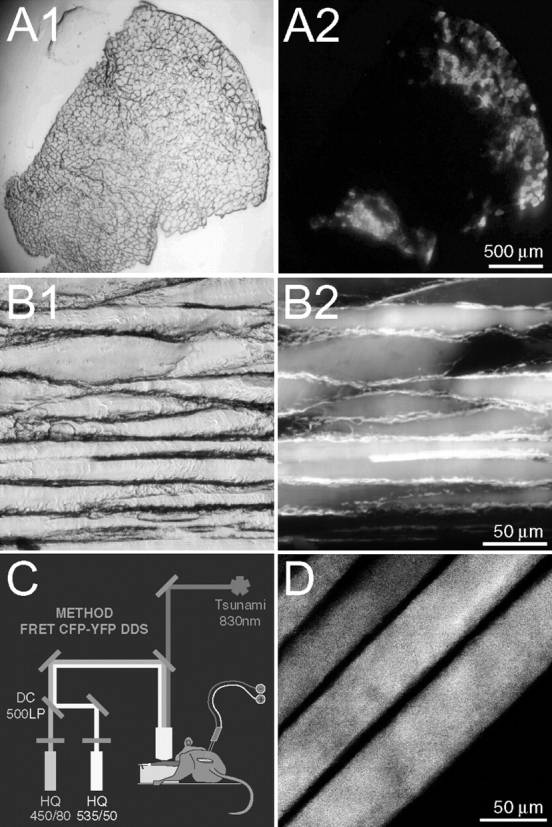
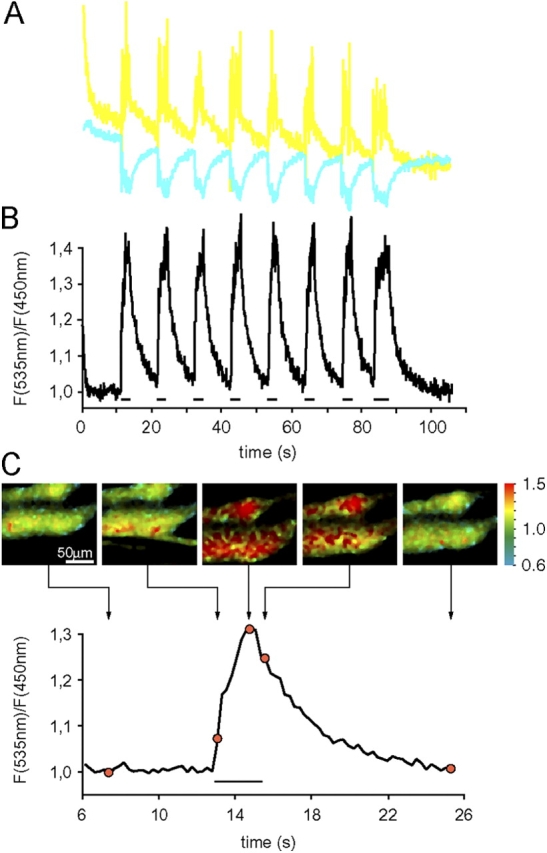
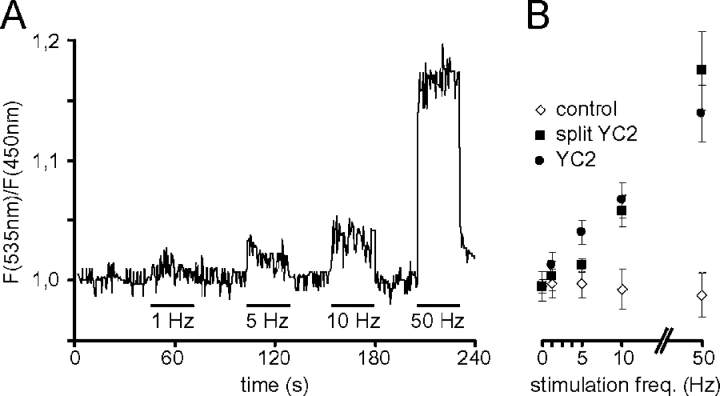
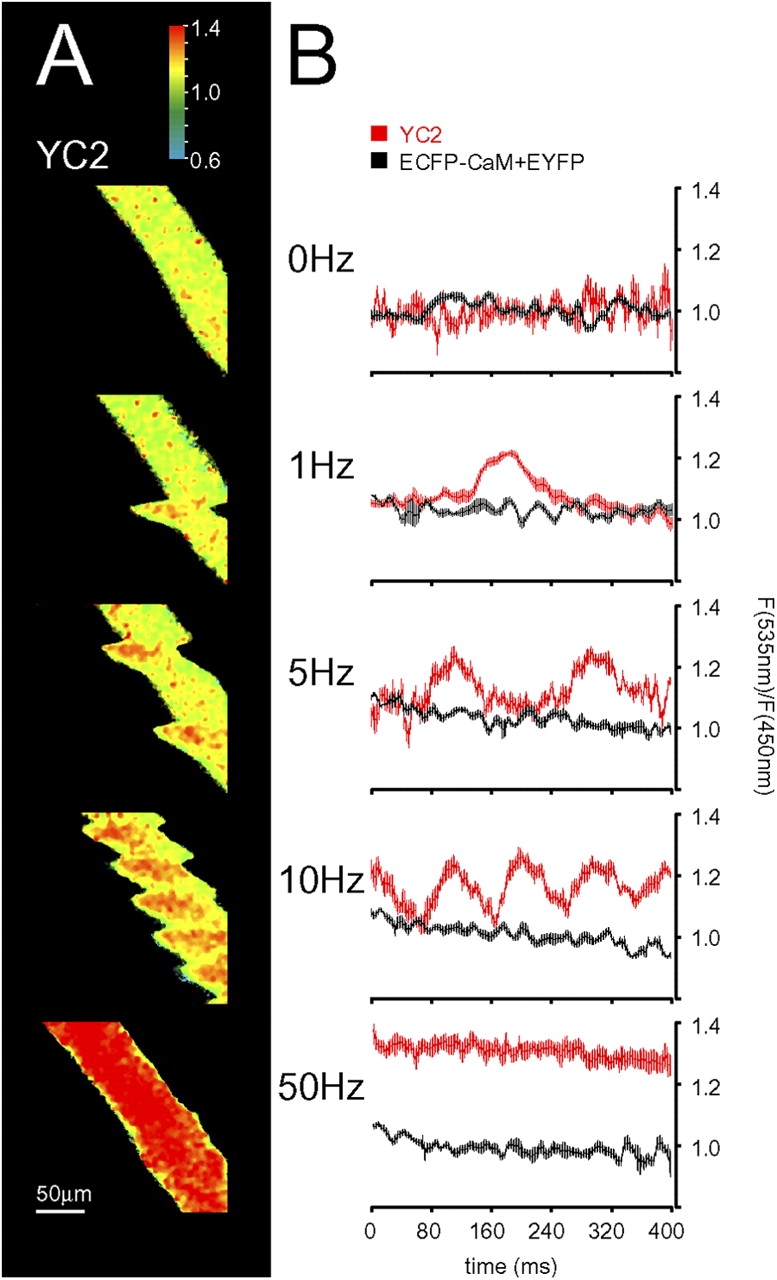
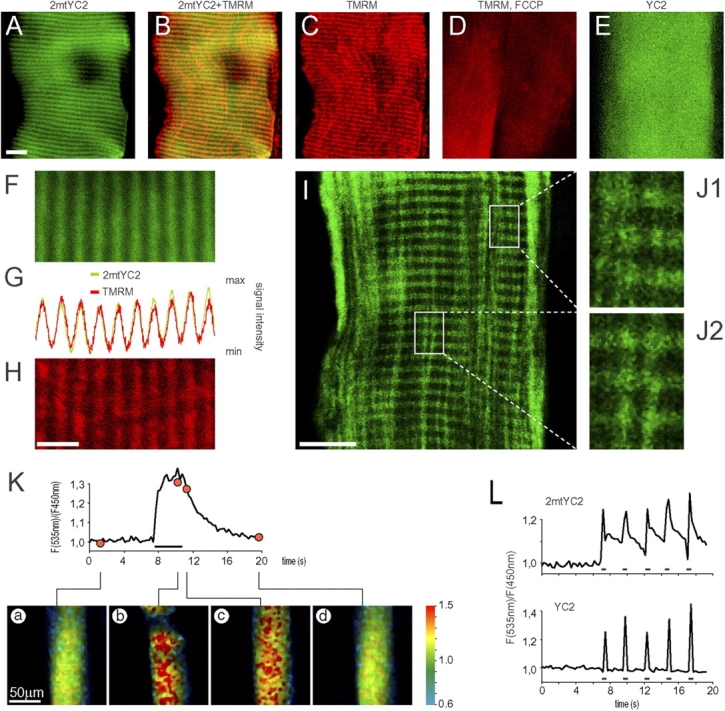
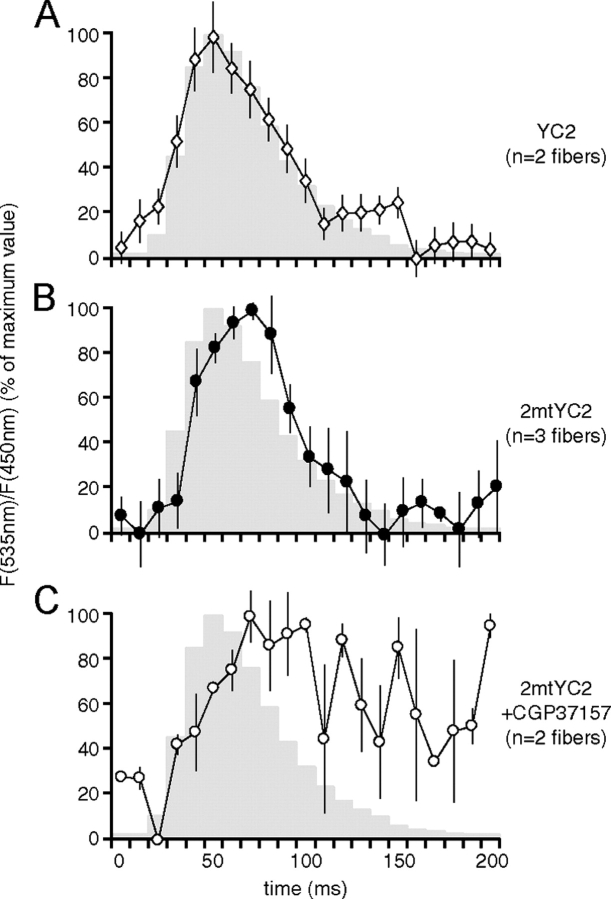
Although the importance of mitochondria in patho-physiology has become increasingly evident, it remains unclear whether these organelles play a role in Ca(2+) handling by skeletal muscle. This undefined situation is mainly due to technical limitations in measuring Ca(2+) transients reliably during the contraction-relaxation cycle. Using two-photon microscopy and genetically expressed "cameleon" Ca(2+) sensors, we developed a robust system that enables the measurement of both cytoplasmic and mitochondrial Ca(2+) transients in vivo. We show here for the first time that, in vivo and under highly physiological conditions, mitochondria in mammalian skeletal muscle take up Ca(2+) during contraction induced by motor nerve stimulation and rapidly release it during relaxation. The mitochondrial Ca(2+) increase is delayed by a few milliseconds compared with the cytosolic Ca(2+) rise and occurs both during a single twitch and upon tetanic contraction.


Figures

Figure 1.
Figure 1.
Genetic expression of YC2 and its visualization in mouse skeletal muscle. Tibialis anterior muscle was transfected as described in the Materials and methods section. (A and B) 3 wk after transfection, the muscle was detached, snap-frozen, sectioned transversally (10-μm slices; A) or longitudinally (30-μm slices; B), and examined by either brightfield (A1 and B1) or fluorescence (A2 and B2) microscopy. Fibers expressing YC2 are visible as bright circular areas (A2) or horizontal stripes (B2). (C) Sketch illustrating the setup for in vivo observation of YC2. The tibialis anterior muscle is exposed to microscopic examination after detaching the distal tendon. Muscle contraction is induced by electric stimulation of the sciatic nerve with a custom-made silver electrode. A Tsunami pulsed femto-second laser beam (830 nm wavelength) is used to excite YC2 expressed in the muscle. CFP- and YFP-fluorescence emissions are simultaneously recorded by two photomultiplier tubes equipped with HQ450/80 and HQ535/50 emission filters, respectively. (D) Representative two-photon micrograph of four fibers expressing YC2 in vivo. The apparent decrease in the width of the fibers is due to the curvature of the muscle, causing the optical section to pass through adjacent fibers at slightly different heights.
Figure 2.
Figure 2.
Observation of cytosolic [Ca 2+ ] spikes during muscle contraction in vivo. Tibialis anterior muscle expressing YC2 was monitored in situ using two-photon microscopy.(A) Individual traces of the fluorescence intensity at 450 ± 40 nm (CFP signal, cyan line) and 535 ± 25 nm (YFP signal, yellow line); the acquisition rate was 9.35 Hz, and the image size 64 × 64 pixels. (B) Corresponding ratio values (YFP/CFP) of the traces shown in A. (C) Expanded trace of a single contraction–relaxation cycle, with representative pseudo-colored ratio images; the exact location of each image in the time course is indicated. The horizontal bars below the traces in B and C represent trains of stimulation with a frequency of 50 Hz; note that the last stimulation in B is longer than the preceding ones, giving rise to a more sustained [Ca2+]c rise.
Figure 3.
Figure 3.
Calibration of the YC2 response to stimulation frequency. Trains with different stimulation frequencies ranging from 1 to 50 Hz were applied as indicated to tibialis anterior muscle expressing either YC2 (A and B), split YC2 (B), or a combination of ECFP-CaM and EYFP (B, control), and the response was monitored in situ by two-photon microscopy. (A) Time course of the YFP/CFP ratio values of a representative calibration experiment. (B) Graph showing the mean YFP/CFP ratio as a function of stimulation frequency. Shown are mean YFP/CFP ratio values of the analyzed images for each stimulation frequency. Error bars show ± SD. All data points are derived from at least two different mice and four different fibers.
Figure 4.
Figure 4.
Kinetic analysis of single twitches with YC2. Tibialis anterior muscle expressing ECFP-CaM and EYFP (B) or YC2 alone (A and B) was observed in situ by two-photon microscopy as described. Muscle contraction was stimulated with different frequencies (1 to 50 Hz) as indicated. (A) Representative ratio images. (B) Graphs showing the distribution of ratio intensities along the fiber length. The ratio along parallel lines within the fiber was measured, and the average calculated; for each stimulation frequency, the same procedure was performed on 10 images. The average intensities along the fiber were “aligned” to the beginning of the first twitch observed in the respective image, and a pooled average was calculated and plotted. Error bars show ± SEM.
Figure 5.
Figure 5.
Co-localization of 2mtYC2 with TMRM and observation of mitochondrial [Ca 2+ ] spikes during muscle contraction in vivo. Tibialis anterior muscles expressing 2mtYC2 (A–D, F–K, and L [top trace]) or YC2 (E and L [bottom trace]) were observed in vivo with two-photon microscopy (A–H, K, and L) or after longitudinal slicing with confocal microscopy (I and J) as described in the Materials and methods section. (A–D) The transfected muscles were injected with TMRM. Fluorescence signals were visualized in vivo. (A) Fluorescence signal of 2mtYC2 pseudo-colored green). Bar, 10 μm. (B) Overlay of 2mtYC2 (green) and TMRM (red) signals; colocalization is shown in yellow. (C) Fluorescence signal of TMRM (red). (D) Fluorescence signal of TMRM (red) in two adjacent fibers after injection of the mitochondrial uncoupler FCCP: the striated localization of TMRM seen in C vanishes almost completely. (E) Fluorescence signal of YC2 (green). (F–H) Co-localization of 2mtYC2 (F; green) and TMRM fluorescence (H; red) shown by a signal intensity profile plot (G). Bar, 5 μm. (I) Confocal section of a longitudinal muscle slice showing 2mtYC2 fluorescence (green). Bar, 10 μm. (J1 and J2) Enlargements of the framed areas in I. (K and L) Trains of 2.5 s (horizontal bar below the trace in K) or 0.5 s (horizontal bars below the traces in L), with a stimulation frequency of 50 Hz, were applied to the muscle. The traces show the YFP/CFP ratio values of 2mtYC2 (K and L, upper trace) and YC2 (L, lower trace) as a function of time. Below K are shown representative ratio images: (a) at rest, (b) during contraction, (c) immediately after the suspension of the stimulus, and (d) back to basal conditions.
Figure 6.
Figure 6.
Mitochondria take up Ca2 + during single twitches. Tibialis anterior muscles expressing (A) YC2 or (B and C) 2mtYC2 were observed with two-photon microscopy as described in the Materials and methods section. In C, CGP37157 was applied. Contractions were elicited by nervous stimulation at 5 Hz. Average YFP/CFP ratio values were determined in 10 ms windows, individual contractions (24, 64, and 24 for A–C, respectively) were synchronized, and the mean ratio values (normalized to the maximum) determined; the degree of contraction is indicated in gray. The maximal ratios reached for the analyzed twitches were on average 1.14 and 1.12 for YC2 and 2mtYC2, respectively. Error bars show ± SEM.

References

    1. Arnaudeau, S., W.L. Kelley, J.V. Walsh Jr., and N. Demaurex. 2001. Mitochondria recycle Ca(2+) to the endoplasmic reticulum and prevent the depletion of neighboring endoplasmic reticulum regions. J. Biol. Chem. 276:29430–29439. - PubMed
    1. Baylor, S.M., and S. Hollingworth. 2003. Sarcoplasmic reticulum calcium release compared in slow-twitch and fast-twitch fibres of mouse muscle. J. Physiol. 551:125–138. - PMC - PubMed
    1. Bernardi, P. 1999. Mitochondrial transport of cations: channels, exchangers, and permeability transition. Physiol. Rev. 79:1127–1155. - PubMed
    1. Bootman, M.D., P. Lipp, and M.J. Berridge. 2001. The organisation and functions of local Ca(2+) signals. J. Cell Sci. 114:2213–2222. - PubMed
    1. Brini, M., F. De Giorgi, M. Murgia, R. Marsault, M.L. Massimino, M. Cantini, R. Rizzuto, and T. Pozzan. 1997. Subcellular analysis of Ca2+ homeostasis in primary cultures of skeletal muscle myotubes. Mol. Biol. Cell. 8:129–143. - PMC - PubMed

Publication types

Grants and funding