Comparative Study
. 2004 Aug 16;200(4):507-17.
doi: 10.1084/jem.20040590.

Basophils produce IL-4 and accumulate in tissues after infection with a Th2-inducing parasite

Affiliations
Comparative Study

Basophils produce IL-4 and accumulate in tissues after infection with a Th2-inducing parasite

Booki Min et al. J Exp Med. .

Abstract

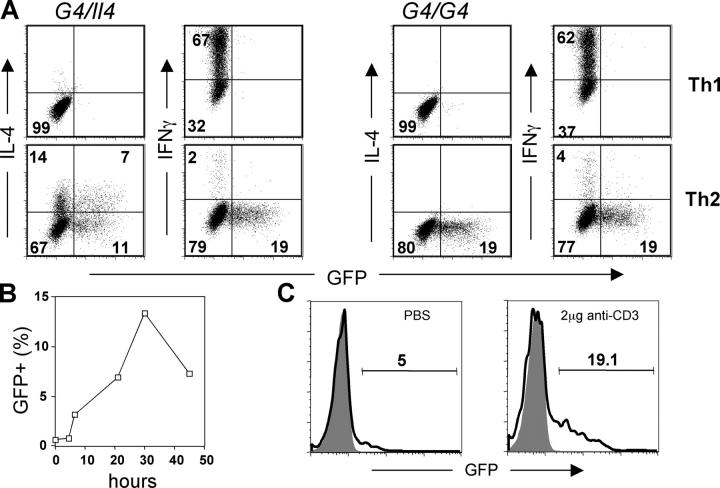
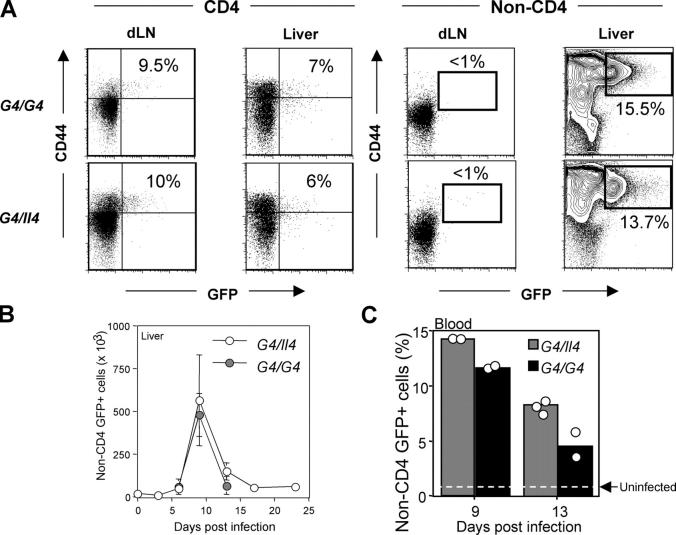
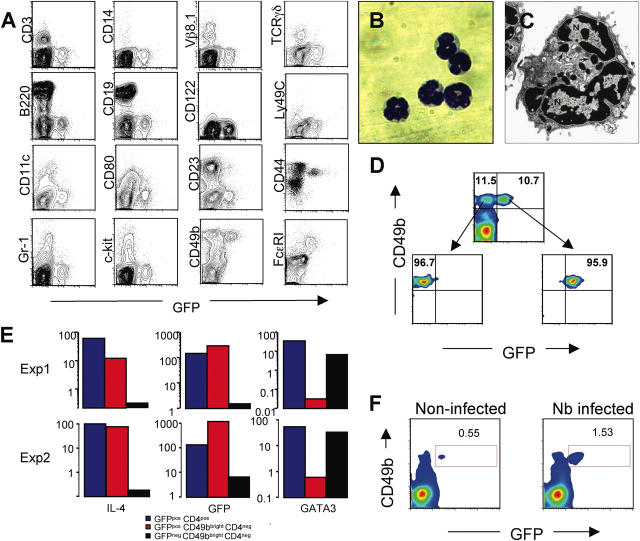
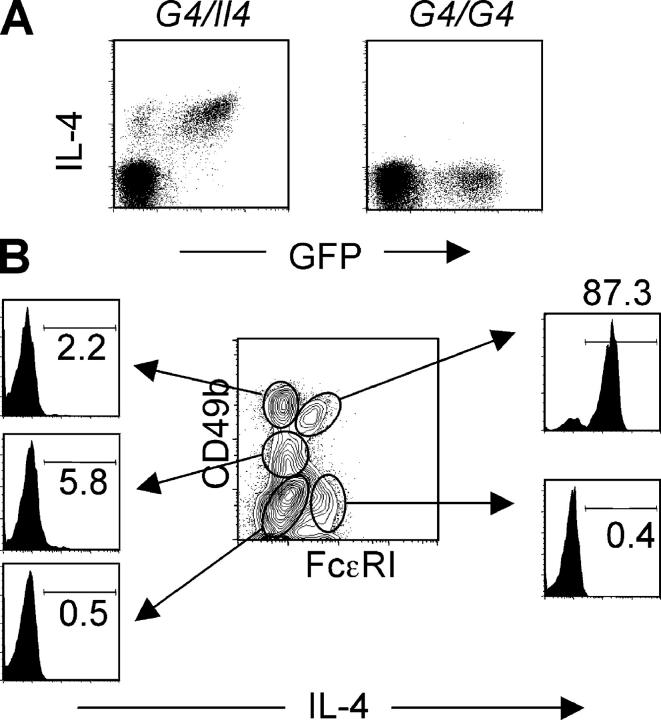
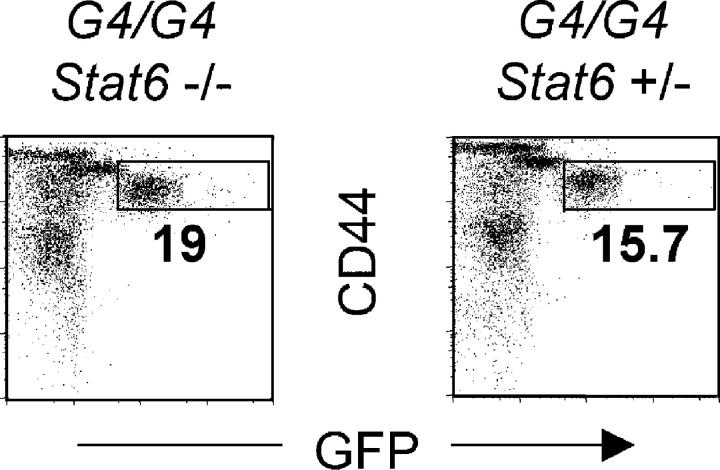
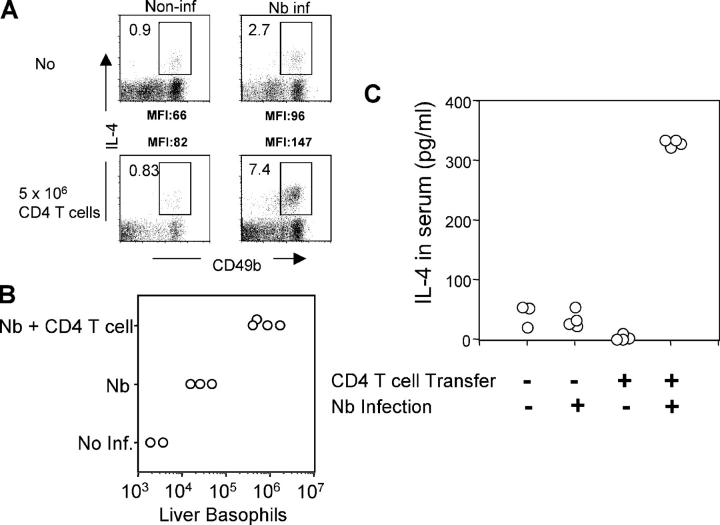
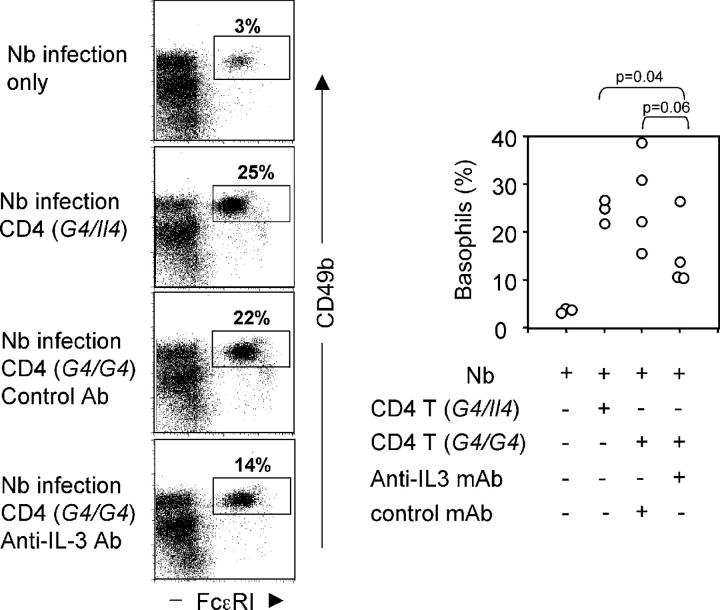
Using mice in which the eGfp gene replaced the first exon of the Il4 gene (G4 mice), we examined production of interleukin (IL)-4 during infection by the intestinal nematode Nippostrongylus brasiliensis (Nb). Nb infection induced green fluorescent protein (GFP)pos cells that were FcepsilonRIpos, CD49bbright, c-kitneg, and Gr1neg. These cells had lobulated nuclei and granules characteristic of basophils. They were found mainly in the liver and lung, to a lesser degree in the spleen, but not in the lymph nodes. Although some liver basophils from naive mice express GFP, Nb infection enhanced GFP expression and increased the number of tissue basophils. Similar basophil GFP expression was found in infected Stat6-/- mice. Basophils did not increase in number in infected Rag2-/- mice; Rag2-/- mice reconstituted with CD4 T cells allowed significant basophil accumulation, indicating that CD4 T cells can direct both tissue migration of basophils and enhanced IL-4 production. IL-4 production was immunoglobulin independent and only partially dependent on IL-3. Thus, infection with a parasite that induces a "Th2-type response" resulted in accumulation of tissue basophils, and these cells, stimulated by a non-FcR cross-linking mechanism, are a principal source of in vivo IL-4 production.


Figures

Figure 1.
Figure 1.
GFP faithfully represents IL-4 expression in G4 knockin mice. (A) Lymph node CD4 T cells were purified from either G4 heterozygous (G4/Il4) or homozygous (G4/G4) mice and stimulated with plate-bound anti-CD3 plus anti-CD28 antibodies for 72 h. IL-12 and anti–IL-4, or IL-4, anti–IL-12, and anti-IFNγ were added in the culture to promote Th1 or Th2 differentiation, respectively. At the end of culture, cells were stimulated with plate-bound anti-CD3 plus anti-CD28 for 6 h. The representative result of intracellular IL-4 and IFNγ staining after stimulation is shown. (B) Resting Th2 CD4 T cells (from G4 homozygous mice) were restimulated with plate-bound antibodies and harvested at indicated times; GFP expresion was measured by flow cytometry. (C) G4 homozygous mice were injected intravenously with either PBS or 2 μg anti-CD3 antibody, and killed 90 min later. GFP expression by splenic NKT cells (NK1.1pos CD4pos) was measured by flow cytometry (bold line). GFP expression by CD4 T cells (NK1.1neg) was used to determine background levels of GFP (shaded area).
Figure 2.
Figure 2.
Induction of GFP+ non-CD4 T cells in response to Nb infection. G4/Il4 and G4/G4 mice were subcutaneously inoculated with 600 Nb L3. (A) Nb-infected mice were killed 10 d later, and GFP expression from both CD4 and non-CD4 T cells was measured. Representative results of GFP expression from the draining lymph nodes and liver are shown. Indicated percentages represent the proportion of GFP+ cells among CD44bright CD4 T cells or among total non-CD4 T cells. Data are representative of more than three independent experiments. (B) Total numbers of non-CD4 GFP+ cells from liver cells were counted. The data were collected from three to four mice for each time point. (C) The percentage of blood GFP+ non-CD4 T cells from individual mice on the indicated date after infection is shown. The dotted line represents blood GFP+ non-CD4 T cells from uninfected mice.
Figure 3.
Figure 3.
GFPpos non-CD4 T cells are basophils. (A) Non-CD4 T cells from liver cells from Nb-infected mice were stained for various surface markers (y axis). (B) GFP+CD49b+ non-CD4 T cells from Nb-infected liver were isolated by cell sorting. A cytospin preparation of sorted cells was stained with Wright-Giemsa (100×). (C) An electron micrograph of a GPF+ basophil reveals a multilobed nucleus (N) and characteristic granules (arrows; 25,000×). (D) Cell sorting profiles for GFP+CD49b+CD4 and GFPCD49b+CD4 cells. (E) mRNA levels for IL-4, GFP, and Gata3 were measured by real-time PCR from sorted populations of basophils (GFP+CD49b+CD4), of GFPCD49b+CD4 cells, and of GFP+ CD4 T cells from Nb-infected mice. (F) The frequency of GFP+CD49b+ cells from bone marrow cells obtained from Nb-infected and noninfected G4 homozygous mice was compared.
Figure 4.
Figure 4.
Basophils are major IL-4 producers. (A) Liver cells from Nb-infected G4 heterozygous and homozygous mice were stimulated in vitro with PMA and ionomycin for 4 h. Cells were stained for intracellular IL-4. The FACS® profile for GFP and IL-4 expression from non-CD4 T cells is shown. (B) Liver cells from Nb-infected BALB/c (non-GFP) mice were stimulated in vitro as mentioned previously. Cells were stained for FcɛRI, CD49b, IL-4, and CD4. The IL-4 staining from each gated population of non-CD4 T cells is shown. Percentages of IL-4 positive cells are indicated. Experiments were repeated three times with similar results.
Figure 5.
Figure 5.
Basophil GFP induction is independent of IL-4 and Stat6. Liver cells from Nb-infected G4 homozygous (IL-4 deficient) Stat6−/− or littermates Stat6+/− mice were stained for CD44 and CD4. The GFP profile from non-CD4 T cells is shown. Experiments were repeated three times with similar results.
Figure 6.
Figure 6.
CD4 T cell–dependent basophil responses. Rag2−/− mice (non-GFP) were infected with Nb. At the time of infection, 5 × 10⁶ purified CD4 T cells from G4 homozygous mice (IL-4–deficient) were transferred into Nb-infected Rag2−/− mice. (A and B) 10 d later, mice were killed, and liver cells were isolated and in vitro stimulated with PMA plus ionomycin. Cells were stained for CD49b, CD4, and IL-4. IL-4 staining from CD49b+ non-CD4 T cells is shown. Indicated is the percentage of IL-4+ cells among non-CD4 T cells (A) or the total number of liver basophils (B, CD49b+FcɛRI+CD4). Experiments were repeated three times with similar results. (C) Rag2−/− mice were infected with Nb, and CD4 T cells were simultaneously administered as mentioned previously. 10 μg of biotin anti–IL-4 antibody was injected intravenously 10 d after infection. The next day, serum was collected from the mice, and serum IL-4 was measured by ELISA as described in Materials and Methods. Each circle represents an individual mouse.
Figure 7.
Figure 7.
Neutralization of IL-3 partially inhibits basophil responses. 5 × 10⁶ CD4 T cells (from either G4 heterozygous or homozygous mice) were transferred into Rag2−/− mice infected with Nb. The infected mice were treated with 2 mg anti–IL-3 (MP2-8F8) or control (GL113) antibody every 3 d. On day 11, liver cells were harvested and analyzed for basophil frequency. The left panel represents flow cytometric data for one individual mouse in each group. The right panel presents data from each mouse with a circle representing results from an individual mouse.

Similar articles

Cited by

References

    1. Seder, R.A., and W.E. Paul. 1994. Acquisition of lymphokine-producing phenotype by CD4+ T cells. Annu. Rev. Immunol. 12:635–673. - PubMed
    1. Finkelman, F.D., J. Holmes, I.M. Katona, J.F. Urban Jr., M.P. Beckmann, L.S. Park, K.A. Schooley, R.L. Coffman, T.R. Mosmann, and W.E. Paul. 1990. Lymphokine control of in vivo immunoglobulin isotype selection. Annu. Rev. Immunol. 8:303–333. - PubMed
    1. Finkelman, F.D., T. Shea-Donohue, J. Goldhill, C.A. Sullivan, S.C. Morris, K.B. Madden, W.C. Gause, and J.F. Urban Jr. 1997. Cytokine regulation of host defense against parasitic gastrointestinal nematodes: lessens from studies with rodent models. Annu. Rev. Immunol. 15:505–533. - PubMed
    1. Naramura, M., R.J. Hu, and H. Gu. 1998. Mice with a fluorescent marker for interleukin 2 gene activation. Immunity. 9:209–216. - PubMed
    1. Hu-li, J., C. Pannetier, L. Guo, M. Lohning, H. Gu, C. Watson, M. Assenmacher, A. Radbruch, and W.E. Paul. 2001. Regulation of expression of IL-4 alleles: analysis using a chimeric GFP/IL-4 gene. Immunity. 14:1–11. - PubMed

Publication types

MeSH terms