. 2004 Sep;24(17):7636-42.
doi: 10.1128/MCB.24.17.7636-7642.2004.

Cell depletion due to diphtheria toxin fragment A after Cre-mediated recombination

Affiliations

Cell depletion due to diphtheria toxin fragment A after Cre-mediated recombination

Damian Brockschnieder et al. Mol Cell Biol. 2004 Sep.

Abstract

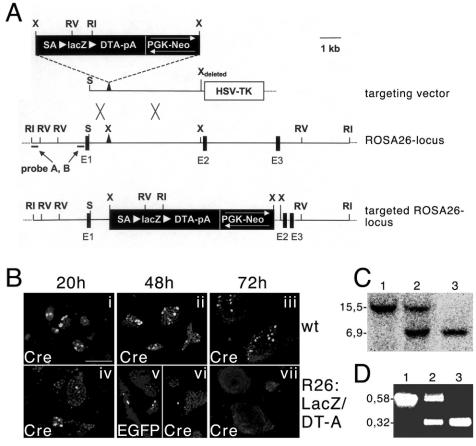
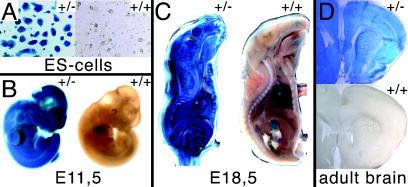
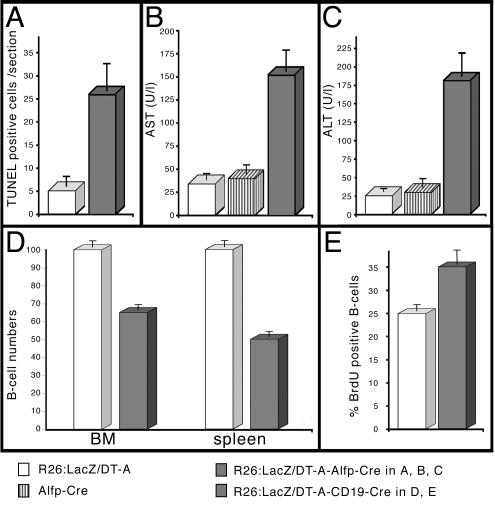
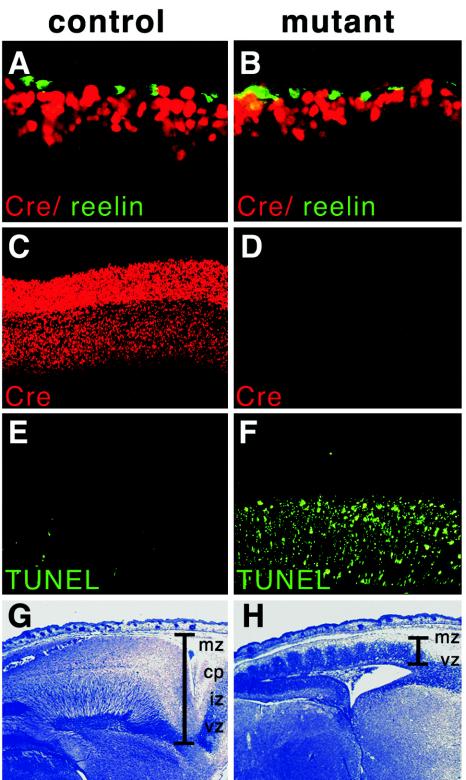
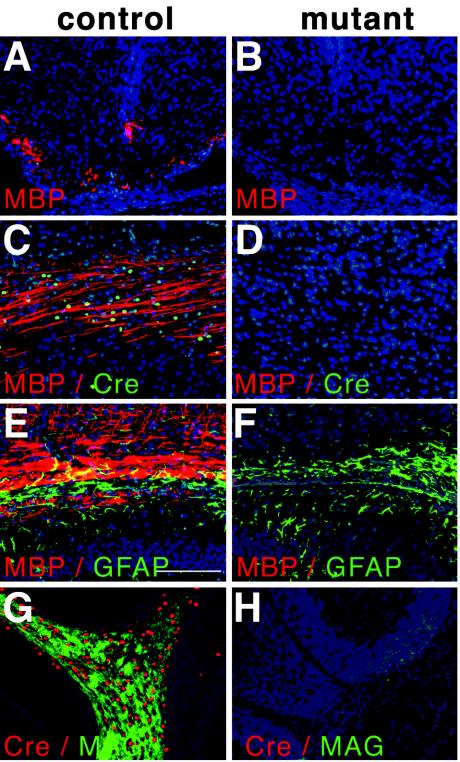
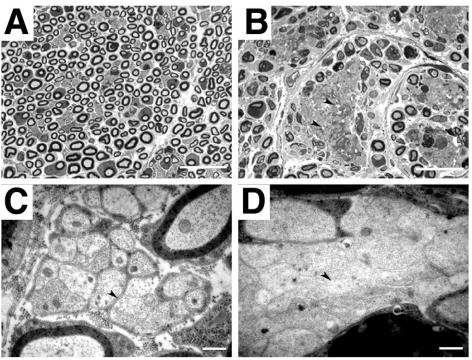
Abnormal cell loss is the common cause of a large number of developmental and degenerative diseases. To model such diseases in transgenic animals, we have developed a line of mice that allows the efficient depletion of virtually any cell type in vivo following somatic Cre-mediated gene recombination. By introducing the diphtheria toxin fragment A (DT-A) gene as a conditional expression construct (floxed lacZ-DT-A) into the ubiquitously expressed ROSA26 locus, we produced a line of mice that would permit cell-specific activation of the toxin gene. Following Cre-mediated recombination under the control of cell-type-specific promoters, lacZ gene expression was efficiently replaced by de novo transcription of the Cre-recombined DT-A gene. We provide proof of this principle, initially for cells of the central nervous system (pyramidal neurons and oligodendrocytes), the immune system (B cells), and liver tissue (hepatocytes), that the conditional expression of DT-A is functional in vivo, resulting in the generation of novel degenerative disease models.


Figures

FIG. 1.
FIG. 1.
Targeted integration of the lacZflox-DT-A cassette into the ROSA26 locus. (A) Schematic representation of the targeting strategy employed to achieve expression of lacZ under control of the ROSA26 promoter. The targeting vector (top), the wild-type ROSA26 locus (middle), and the targeted ROSA26 locus (bottom) are shown. Restriction sites for EcoRI (RI), EcoRV (RV), XbaI (X), and SacII (S), as well as the location of 5′ probes (probes A and B), are indicated. Black boxes represent exons 1 to 3 (E1 through E3), and white arrowheads flanking the lacZflox-DT-A cassette indicate loxP sites. (B) Transfection of wild-type and targeted ES cells with plasmids driving the expression of Cre (i, ii, iii, iv, vi, and vii) or EGFP plus Cre (v). The cells were fixed and monitored for expression of Cre after 20, 48, or 72 h. Note the extinction of the Cre-positive cells after transfection into targeted ES cells after 48 and 72 h. The presence of EGFP, which allows analysis without washing and fixation, at 48 h in some double-transfected mutant cells (v) demonstrates that the almost-complete loss of Cre expression (vi) is partially due to the experimental procedure. Scale bar, 125 μm. (C) Southern blot analysis of DNA from wild-type, heterozygous, and homozygous mutant mice after digestion with EcoRI; the expected sizes of the fragments detected by probe A used for hybridization are indicated (wild type, 15.5 kb; mutant, 6.9 kb). (D) PCR analysis of DNA from wild-type, heterozygous, and homozygous mutant mice; sizes for wild-type (0.58 kb) and mutant (0.32 kb) fragments are indicated.
FIG. 2.
FIG. 2.
Monitoring of lacZ activity in ES cells, embryos, and adult tissues. (A) Analysis of β-galactosidase activity in R26:LacZ/DT-A (left) and control (right) ES cells. (B) Whole-mount E11.5 R26:LacZ/DT-A embryos (left) were positive for lacZ, in contrast to the corresponding control embryo (right). (C) Sagittal section of E18.5 embryos showed ubiquitous expression and activity of lacZ in R26:LacZ/DT-A embryos (left) and only restricted background activity in control embryos (right). (D) β-Galactosidase activity in brain isolated from R26:LacZ/DT-A adult animals (top) versus activity in brain tissue isolated from control animals (bottom).
FIG. 3.
FIG. 3.
Serum AST and ALT levels and B-cell reduction; cell depletion in liver and blood. (A) Determination of apoptosis rates by the TUNEL method in liver tissue isolated from 6-week-old control (white column) and mutant (grey column) animals. (B and C) Mean serum activity levels of AST (B) and ALT (C) from 6-week-old animals (number of mice per condition, 4 to 6). White columns, results for single-transgene R26:LacZ/DT-A animals; striped columns, results for single-transgene Alfp-Cre animals; grey columns, results for double-transgene R26:LacZ/DT-A Alfp-Cre animals. The five- to sevenfold increase is statistically significant. (D) Results for the quantification of B-cell (CD19/B220 positive) depletion in lymphocyte preparations of bone marrow (BM) and spleen from control animals (white columns) and mutant animals (grey columns). The control values were in the range of published data and normalized to 100%, compared to 65% in mutant bone marrow or 50% in mutant splenic lymphocyte preparations. (E) Quantification of proliferating, BrdU-positive B cells (B220 positive) isolated from spleen. The 25% increase in proliferating B cells in preparations from mutant (grey columns) animals compared to control (white columns) is statistically significant.
FIG. 4.
FIG. 4.
Depletion of cortical neurons. (A and B) Immunohistochemical analyses of E12.5 embryo cortices with Cre-specific (red) and reelin-specific (green) antibodies. Note the slightly thinner layer of Cre-positive cells in the mutant cells (B) adjacent to the reelin-expressing cells. (C and D) Immunohistochemical analyses of E16.5 embryo cortices with a Cre-specific antibody. Note the almost complete absence of immunoreactivity in the mutant cortex (D) compared to the distinct staining in the different layers from the control cortex (C). (E and F) TUNEL analysis of sections from E16.5 cortices. In the control section, only a few positive cells could be detected in the intermediate zone and cortical plate (E), while the vast majority of cells was labeled in sections from mutants (F). (G and H) Histological analyses of E18.5 embryos. Note the abnormal wavelike structure emerging from the ventricular zone in the extremely thin mutant cortex (H) compared to the normal layering of the control cortex (G). The different layers are indicated. mz, marginal zone; cp, cortical plate; iz, intermediate zone; vz, ventricular. In results not shown here, lacZ staining of sagittally sectioned vibratome slices revealed regular migration of unrecombined (lacZ-positive) subventricular cells into the intermediate zone, where the absence of lacZ staining demonstrates that Cre-mediated recombination had already occured, unlike the regular lacZ pattern in the normally layered cortex of the control section.
FIG. 5.
FIG. 5.
Depletion of oligodendrocytes. (A and B) Immunofluorescence analysis with MBP-specific antibodies of spinal cord sections from early postnatal animals. Note the presence of staining in the control tissue at ventrolateral positions and absence of staining in the mutant tissue. (C and D) CNS sections from P3 animals analyzed with MBP-specific (red) and Cre-specific (green) antibodies. Note the colocalized expression of Cre and MBP and the absence of staining in the mutant. (E-H) Immunofluorescent analyses of P14 animals, showing parts of the corpus callosum (E and F) and cerebellum (G and H). Analysis with GFAP-specific (green) and MBP-specific (red) antibodies revealed normal staining for GFAP in the mutant but an absence of MPB expression (F). Cre-specific (red) and MAG-specific (green) antibodies revealed the colocalization of both antigens in the cerebellum of the control (G) and complete absence in corresponding sections from the mutant (H).
FIG. 6.
FIG. 6.
Schwann cell ablation in the sciatic nerve. (A and B) Histological analyses of semithin sections from control (A) and mutant (B) sciatic nerves, showing large areas of unmyelinated axons next to apparently normally myelinated axons (B). (C and D) Higher magnification revealed that axons were in direct contact with each other (arrowhead, D) and not separated by Schwann cell cytoplasm as in unmyelinated control axons (arrowhead, C). Very often, axons showed clear signs of degeneration, such as vacuoles and electron-dense plaques. Scale bars, 40 μm (A and B) and 2 μm (C and D).

References

    1. Amiel, J., and S. Lyonnet. 2001. Hirschsprung disease, associated syndromes, and genetics: a review. J. Med. Genet. 38:729-739. - PMC - PubMed
    1. Argos, P., A. Landy, K. Abremski, J. B. Egan, E. Haggard-Ljungquist, R. H. Hoess, M. L. Kahn, B. Kalionis, S. V. Narayana, L. S. Pierson III, et al. 1986. The integrase family of site-specific recombinases: regional similarities and global diversity. EMBO J. 5:433-440. - PMC - PubMed
    1. Awatramani, R., P. Soriano, J. J. Mai, and S. Dymecki. 2001. An Flp indicator mouse expressing alkaline phosphatase from the ROSA26 locus. Nat. Genet. 29:257-259. - PubMed
    1. Bartholoma, A., and K. A. Nave. 1994. NEX-1: a novel brain-specific helix-loop-helix protein with autoregulation and sustained expression in mature cortical neurons. Mech. Dev. 48:217-228. - PubMed
    1. Chandross, K. J., R. I. Cohen, P. Paras, Jr., M. Gravel, P. E. Braun, and L. D. Hudson. 1999. Identification and characterization of early glial progenitors using a transgenic selection strategy. J. Neurosci. 19:759-774. - PMC - PubMed

Publication types

MeSH terms

LinkOut - more resources