

Reassessing random-coil statistics in unfolded proteins
- PMID: 15314216
- PMCID: PMC514656
- DOI: 10.1073/pnas.0404236101
Reassessing random-coil statistics in unfolded proteins
Abstract
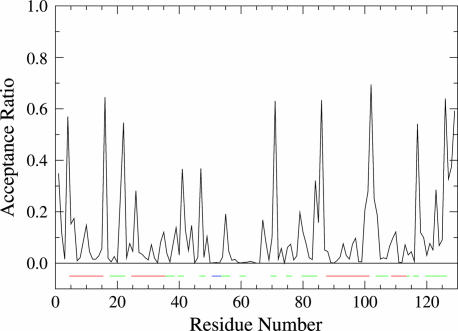
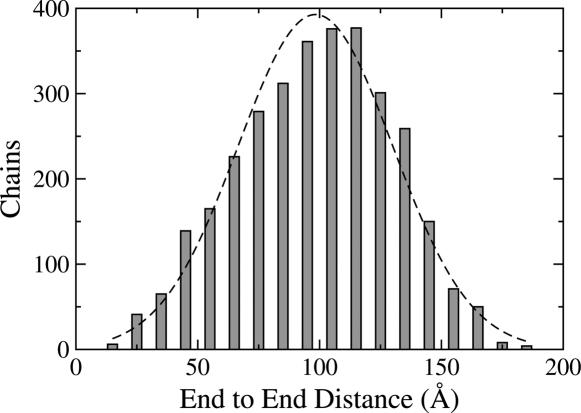
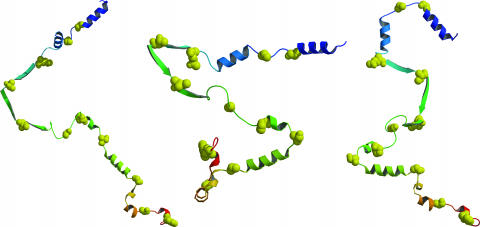
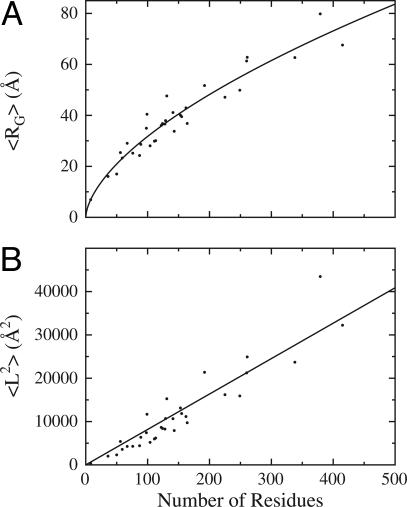
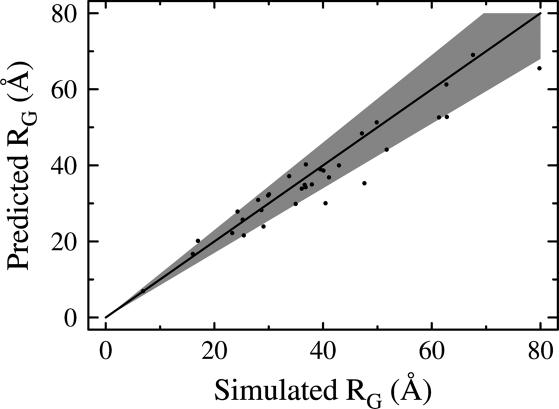
The Gaussian-distributed random coil has been the dominant model for denatured proteins since the 1950s, and it has long been interpreted to mean that proteins are featureless, statistical coils in 6 M guanidinium chloride. Here, we demonstrate that random-coil statistics are not a unique signature of featureless polymers. The random-coil model does predict the experimentally determined coil dimensions of denatured proteins successfully. Yet, other equally convincing experiments have shown that denatured proteins are biased toward specific conformations, in apparent conflict with the random-coil model. We seek to resolve this paradox by introducing a contrived counterexample in which largely native protein ensembles nevertheless exhibit random-coil characteristics. Specifically, proteins of known structure were used to generate disordered conformers by varying backbone torsion angles at random for approximately 8% of the residues; the remaining approximately 92% of the residues remained fixed in their native conformation. Ensembles of these disordered structures were generated for 33 proteins by using a torsion-angle Monte Carlo algorithm with hard-sphere sterics; bulk statistics were then calculated for each ensemble. Despite this extreme degree of imposed internal structure, these ensembles have end-to-end distances and mean radii of gyration that agree well with random-coil expectations in all but two cases.
Figures
Similar articles
-
Statistical coil model of the unfolded state: resolving the reconciliation problem.Proc Natl Acad Sci U S A. 2005 Sep 13;102(37):13099-104. doi: 10.1073/pnas.0506078102. Epub 2005 Aug 30. Proc Natl Acad Sci U S A. 2005. PMID: 16131545 Free PMC article.
-
Random-coil behavior and the dimensions of chemically unfolded proteins.Proc Natl Acad Sci U S A. 2004 Aug 24;101(34):12491-6. doi: 10.1073/pnas.0403643101. Epub 2004 Aug 16. Proc Natl Acad Sci U S A. 2004. PMID: 15314214 Free PMC article.
-
Influence of local and residual structures on the scaling behavior and dimensions of unfolded proteins.Biopolymers. 2007 Jul;86(4):321-8. doi: 10.1002/bip.20747. Biopolymers. 2007. PMID: 17450572
-
Atomic-level characterization of disordered protein ensembles.Curr Opin Struct Biol. 2007 Feb;17(1):3-14. doi: 10.1016/j.sbi.2007.01.009. Epub 2007 Jan 23. Curr Opin Struct Biol. 2007. PMID: 17250999 Review.
-
Residual ordered structure in denatured proteins and the problem of protein folding.Indian J Biochem Biophys. 2012 Feb;49(1):7-17. Indian J Biochem Biophys. 2012. PMID: 22435139 Review.
Cited by
-
Slow unfolded-state structuring in Acyl-CoA binding protein folding revealed by simulation and experiment.J Am Chem Soc. 2012 Aug 1;134(30):12565-77. doi: 10.1021/ja302528z. Epub 2012 Jul 19. J Am Chem Soc. 2012. PMID: 22747188 Free PMC article.
-
Calmodulin-induced structural changes in endothelial nitric oxide synthase.FEBS Lett. 2013 Jan 31;587(3):297-301. doi: 10.1016/j.febslet.2012.12.012. Epub 2012 Dec 22. FEBS Lett. 2013. PMID: 23266515 Free PMC article.
-
Sequence-specific solvent accessibilities of protein residues in unfolded protein ensembles.Biophys J. 2006 Dec 15;91(12):4536-43. doi: 10.1529/biophysj.106.087528. Epub 2006 Sep 29. Biophys J. 2006. PMID: 17012314 Free PMC article.
-
Impact of Heat on Coil Hydrodynamic Size Yields the Energetics of Denatured State Conformational Bias.J Phys Chem B. 2019 Nov 27;123(47):10014-10024. doi: 10.1021/acs.jpcb.9b09088. Epub 2019 Nov 14. J Phys Chem B. 2019. PMID: 31679343 Free PMC article.
-
Formation of a molten globule like state in bovine serum albumin at alkaline pH.Eur Biophys J. 2008 Oct;37(8):1303-8. doi: 10.1007/s00249-008-0335-7. Epub 2008 May 8. Eur Biophys J. 2008. PMID: 18463861
References
-
- Dunker, A. K., Lawson, J. D., Brown, C. J., Williams, R. M., Romero, P., Oh, J. S., Oldfield, C. J., Campen, A. M., Ratliff, C. M., Hipps, K. W., et al. (2001) J. Mol. Graphics Model. 19, 26–59. - PubMed
-
- Flory, P. J. (1969) Statistical Mechanics of Chain Molecules (Wiley, New York).
-
- Tanford, C. (1968) Adv. Protein Chem. 23, 121–282. - PubMed
-
- de Gennes, P.-G. (1979) Scaling Concepts in Polymer Ohysics (Cornell Univ. Press, Ithaca, NY).
-
- Tanford, C., Kawahara, K. & Lapanje, S. (1966) J. Biol. Chem. 241, 1921–1923. - PubMed
Publication types
MeSH terms
Substances
LinkOut - more resources
Full Text Sources
Other Literature Sources
