

Emissions pathways, climate change, and impacts on California
- PMID: 15314227
- PMCID: PMC514653
- DOI: 10.1073/pnas.0404500101
Emissions pathways, climate change, and impacts on California
Abstract
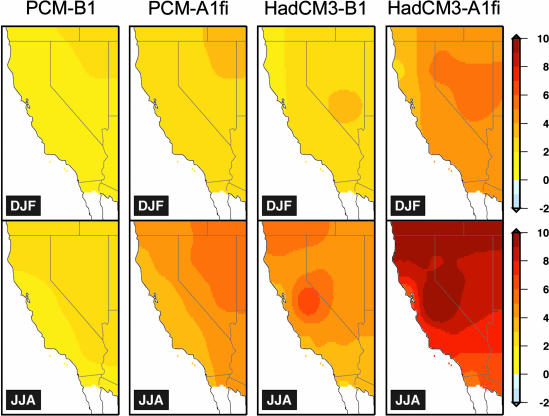
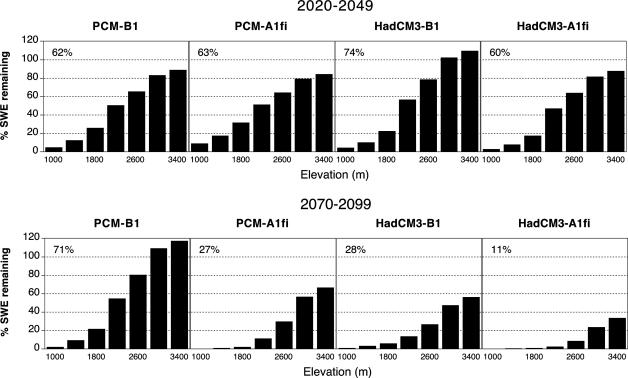
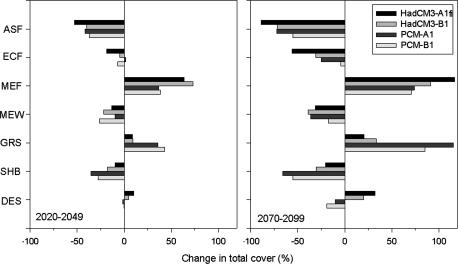
The magnitude of future climate change depends substantially on the greenhouse gas emission pathways we choose. Here we explore the implications of the highest and lowest Intergovernmental Panel on Climate Change emissions pathways for climate change and associated impacts in California. Based on climate projections from two state-of-the-art climate models with low and medium sensitivity (Parallel Climate Model and Hadley Centre Climate Model, version 3, respectively), we find that annual temperature increases nearly double from the lower B1 to the higher A1fi emissions scenario before 2100. Three of four simulations also show greater increases in summer temperatures as compared with winter. Extreme heat and the associated impacts on a range of temperature-sensitive sectors are substantially greater under the higher emissions scenario, with some interscenario differences apparent before midcentury. By the end of the century under the B1 scenario, heatwaves and extreme heat in Los Angeles quadruple in frequency while heat-related mortality increases two to three times; alpine/subalpine forests are reduced by 50-75%; and Sierra snowpack is reduced 30-70%. Under A1fi, heatwaves in Los Angeles are six to eight times more frequent, with heat-related excess mortality increasing five to seven times; alpine/subalpine forests are reduced by 75-90%; and snowpack declines 73-90%, with cascading impacts on runoff and streamflow that, combined with projected modest declines in winter precipitation, could fundamentally disrupt California's water rights system. Although interscenario differences in climate impacts and costs of adaptation emerge mainly in the second half of the century, they are strongly dependent on emissions from preceding decades.
Figures
References
-
- Nakićenović, N., Alcamo, J., Davis, G., de Vries, B., Fenhann, J., Gaffin, S., Gregory, K., Grübler, A., Jung, T. Y., Kram, T., et al. (2000) Intergovernmental Panel on Climate Change Special Report on Emissions Scenarios (Cambridge Univ. Press, Cambridge, U.K.).
-
- Parry, M. (2002) Global Environ. Change 12 (3), 149–153.
-
- Washington, W. M., Weatherly, J. W., Meehl, G. A., Semtner, A. J., Bettge, T. W., Craig, A. P., Strand, W. G., Arblaster, J., Wayland, V. B., James, R. & Zhang, Y. (2000) Clim. Dyn. 16, 755–774.
-
- Gordon, C., Cooper, C., Senior, C. A., Banks, H., Gregory, J. M., Johns, T. C., Mitchell, J. F. B. & Wood, R. A. (2000) Clim. Dyn. 16, 147–168.
-
- Pope, V. D., Gallani, M. L., Rowntree, P. R. & Stratton, R. A. (2000) Clim. Dyn. 16, 123–146.
Publication types
MeSH terms
LinkOut - more resources
Full Text Sources
Medical
