. 2004 Aug 24;101(34):12503-7.
doi: 10.1073/pnas.0403538101. Epub 2004 Aug 16.

Single-molecule recognition imaging microscopy

Affiliations

Single-molecule recognition imaging microscopy

C Stroh et al. Proc Natl Acad Sci U S A. .

Abstract

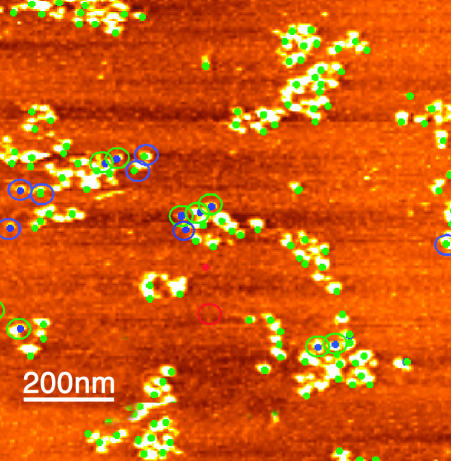
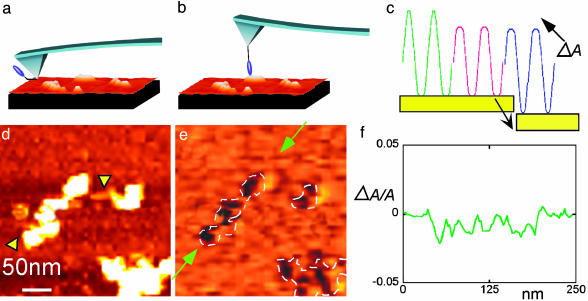
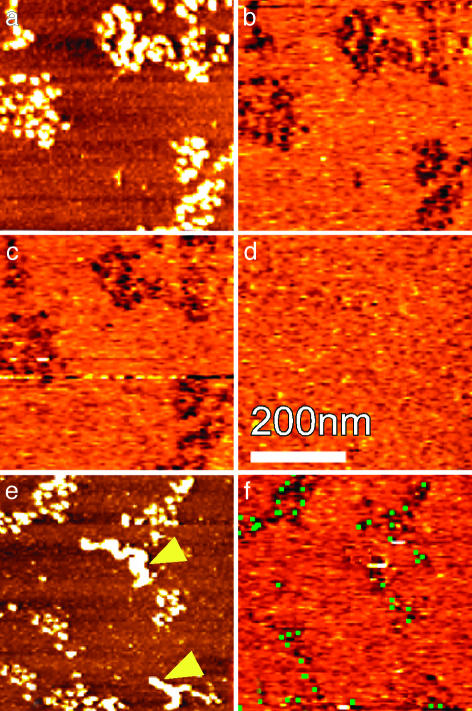
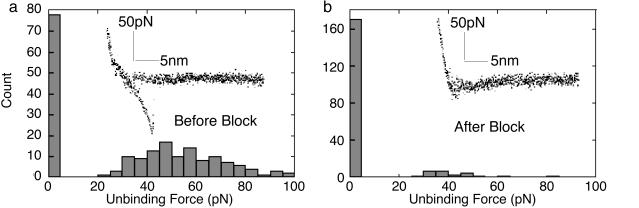
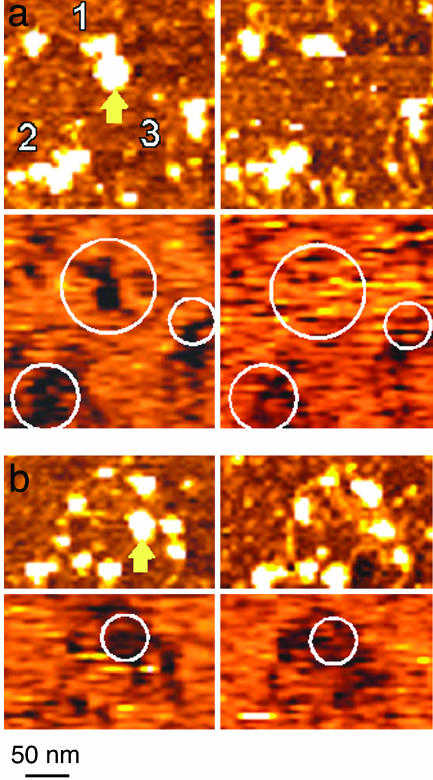
Atomic force microscopy is a powerful and widely used imaging technique that can visualize single molecules and follow processes at the single-molecule level both in air and in solution. For maximum usefulness in biological applications, atomic force microscopy needs to be able to identify specific types of molecules in an image, much as fluorescent tags do for optical microscopy. The results presented here demonstrate that the highly specific antibody-antigen interaction can be used to generate single-molecule maps of specific types of molecules in a compositionally complex sample while simultaneously carrying out high-resolution topographic imaging. Because it can identify specific components, the technique can be used to map composition over an image and to detect compositional changes occurring during a process.


Figures

Fig. 4.
Fig. 4.
The efficiency and repeatability of recognition imaging. Spots from a recognition image are superimposed (as green dots) on its corresponding topographic image. Features present in the topographic image but not in the recognition image are marked by blue dots. A recognition feature with no corresponding topographic feature (near middle of the image) is marked by a red spot. Changes in recognition events after rescanning are indicated by the circles color-coded with the same scheme (no circle equals no change after rescanning). For example, a feature recognized in the first scan but not in the second is shown by a green dot (recognition in the first scan) surrounded by a blue circle (not recognized on the second scan). The recognition efficiency generally remains >90%.
Fig. 1.
Fig. 1.
Recognition imaging. When an AFM tip-tethered antibody (blue blob in a) binds to its antigen in the sample being scanned (b), there is a transient reduction in the oscillation amplitude of the tip (green curve to red curve in c). The imaging servo restores the signal amplitude but with the peak signal shifted downward by an amount ΔA (blue curve in c). This peak shift provides the recognition signal for a specific antigen–antibody recognition event. A topographic image of MMTV arrays and the corresponding recognition image (a “map” of the change in peak signal, ΔA) are shown in d and e, respectively. These images were obtained simultaneously from one scan of the sample by using an H3-specific antibody tethered to the AFM tip. A plot of the peak signal, ΔA, for the portion of the recognition image between the green arrows (e) is shown in f. The dips in signal correspond well with the location of nucleosomes, and the changes in peak signal (traced in f) are in quantitative agreement with theory (see text). The xy scale is shown in d. The highest features in d are ≈5 nm.
Fig. 2.
Fig. 2.
The specificity of recognition imaging. Topographic (a) and recognition (b) images of MMTV nucleosomal arrays similar to those shown in Fig. 1 are shown. Recognition images from the same region of the sample taken after addition of BSA into the sample in the flow cell (c) and then after the addition of ARTKQTARKSTGGKAPRKQLC (which corresponds to the N-terminal tail of histone H3) (d) are also shown. (e) Topographic image of a field with BSA aggregates pointed to by yellow arrowheads. (f) Recognition images of this same field after BSA was added. The recognition image obtained before BSA addition is superimposed on the recognition signal after BSA addition as green dots. The coincidence of the green dots and dark spots demonstrates that the added BSA did not interfere with the H3 recognition.
Fig. 3.
Fig. 3.
Force curves for antibody-tethered tips. Histograms of the measured adhesion forces for an antibody-tethered tip probing a field of MMTV nucleosomal array molecules (a) and the same tip scanning in the presence of 30 μg/ml of a peptide from the N-terminal tail of histone H3, showing how the blocked antibody does not adhere to the sample surface (b). Two hundred force curves were analyzed for each histogram (bars at the origins are the numbers of force curves in which no adhesion force was measured). (Insets) Typical examples of force-versus-distance curves obtained. The curve in a shows the characteristic single-molecule binding curve characteristic of PEG stretching, whereas the curve in b shows negligible adhesion. The average adhesion forces are 57 ± 20 pN (absence of H3 tail peptide), 6 pN (presence of tail peptide), 116 ± 63 pN (PEG tether alone), and 118 ± 134 pN for the bare (clean) tip. Thus, the tethered antibody plays an important role in reducing nonspecific adhesion.
Fig. 5.
Fig. 5.
Using recognition imaging to study a complex, biologically relevant process. Some examples of the changes seen after hSwi-Snf activation (by ATP) in deposited MMTV nucleosomal arrays are shown. a and b Upper shows topographic images taken before (Left) and after (Right) ATP addition. a and b Lower shows corresponding recognition images obtained with an anti-H3 tip. Protein loss on ATP addition (yellow arrows in the –ATP images) is accompanied by loss of the recognition signal showing that the lost features were likely not hSwi-Snf. Molecules labeled 2 and 3 in a appear unchanged in the topographic image but show loss of recognition signal after ATP addition. (The scale shown at the bottom applies to all the images.)

References

    1. Drake, B., Prater, C. B., Weisenhorn, A. L., Gould, S. A. C., Albrecht, T. R., Quate, C. F., Cannell, D. S., Hansma, H. G. & Hansma, P. K. (1989) Science 243, 1586–1589. - PubMed
    1. Noy, A., Vezenov, D. V. & Lieber, C. M. (1997) Annu. Rev. Mater. Sci. 27, 381–421.
    1. A-Hassan, E., Heinz, W. F., Antonik, M. D., D'Costa, N. P., Nageswaran, S., Schoenenberger, C. & Hoh, J. H. (1998) Biophys. J. 74, 1564–1578. - PMC - PubMed
    1. Hinterdorfer, P., Baumgartner, W., Gruber, H. J., Schilcher, K. & Schindler, H. (1996) Proc. Natl. Acad. Sci. USA 93, 3477–3481. - PMC - PubMed
    1. Raab, A., Han, W., Badt, D., Smith-Gill, S. J., Lindsay, S. M., Schindler, H. & Hinterdorfer, P. (1999) Nat. Biotechnol. 901–905. - PubMed

Publication types

LinkOut - more resources