Comparative Study
. 2004 Aug;114(4):589-97.
doi: 10.1172/JCI21307.

Mature high-affinity immune responses to (pro)insulin anticipate the autoimmune cascade that leads to type 1 diabetes

Affiliations
Comparative Study

Mature high-affinity immune responses to (pro)insulin anticipate the autoimmune cascade that leads to type 1 diabetes

Peter Achenbach et al. J Clin Invest. 2004 Aug.

Abstract

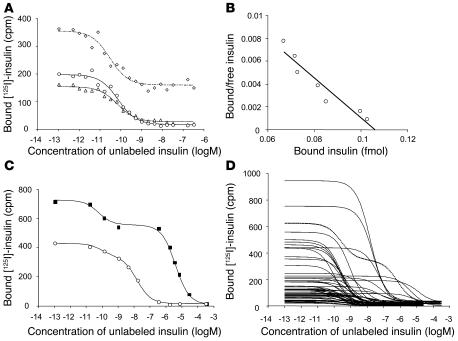
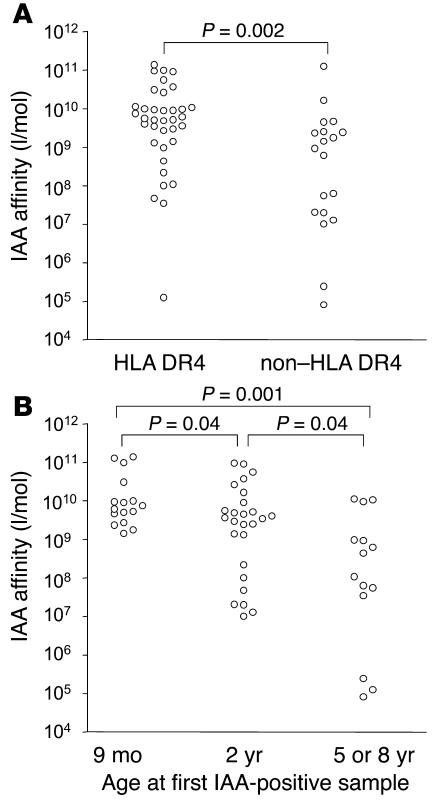
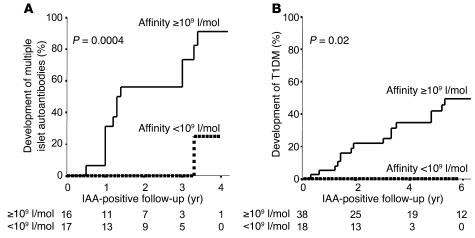
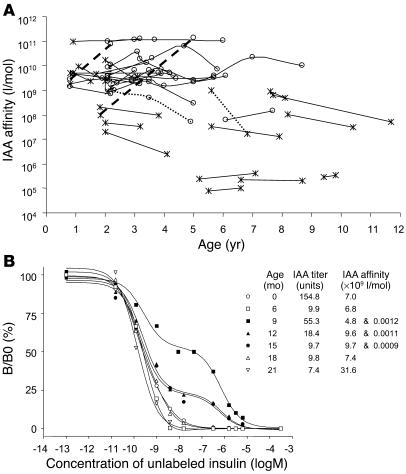
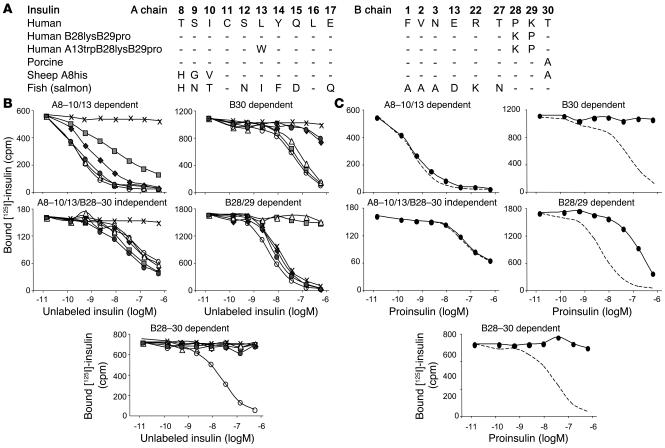
Children at risk for type 1 diabetes can develop early insulin autoantibodies (IAAs). Many, but not all, of these children subsequently develop multiple islet autoantibodies and diabetes. To determine whether disease progression is reflected by autoantibody maturity, IAA affinity was measured by competitive radiobinding assay in first and subsequent IAA-positive samples from children followed from birth in the BABYDIAB cohort. IAA affinity in first positive samples ranged from less than 10(6) l/mol to more than 10(11) l/mol. High affinity was associated with HLA DRB1*04, young age of IAA appearance, and subsequent progression to multiple islet autoantibodies or type 1 diabetes. IAA affinity in multiple antibody-positive children was on average 100-fold higher than in children who remained single IAA positive or became autoantibody negative. All high-affinity IAAs required conservation of human insulin A chain residues 8-13 and were reactive with proinsulin. In contrast, most lower-affinity IAAs were dependent on COOH-terminal B chain residues and did not bind proinsulin. These data are consistent with the concept that type 1 diabetes is associated with sustained early exposure to (pro)insulin in the context of HLA DR4 and show that high-affinity proinsulin-reactive IAAs identify children with the highest diabetes risk.


Figures

Figure 1
Figure 1
Competitive insulin binding curves of IAAs. (A) Competition of an IAA-positive serum against [125I] insulin labeled at Tyr14A (circles), Tyr19A (triangles), and Tyr16B (diamonds) with increasing concentrations of unlabeled human insulin. Binding curves were similar with the [125I] insulin labeled at residues Tyr14A, Tyr19A, or Tyr16B, and calculated IAA affinities did not significantly differ among Tyr14A [125I] insulin (2.1 × 10¹¹ l/mol), Tyr19A [125I] insulin (2.3 × 10¹¹ l/mol), and Tyr16B [125I] insulin (5.7 × 10¹¹ l/mol). Insulin labeled at position Tyr16B was associated with considerably higher nonspecific binding than insulin labeled at Tyr14A or Tyr19A. (B) Scatchard analysis performed for the competition curve obtained against Tyr14A radiolabeled insulin. (C) Binding curves of a serum mix containing a serum with high-affinity IAAs (1.7 × 10¹¹ l/mol) and a serum with low-affinity IAAs (2 × 10⁵ l/mol) (squares) and a serum mix containing a serum with high-affinity IAAs (1.7 × 10¹¹ l/mol) and a serum with moderate-affinity IAAs (6.3 × 10⁷ l/mol) (circles). Both curves fit a 2-site binding model. (D) Binding curves obtained for the first IAA-positive serum from 56 children in the BABYDIAB study. IAA binding in 1 serum conforms to a 2-site binding model (dotted line), whereas the remaining sera conform to a 1-site binding model. Curves that are shifted to the right indicate lower-affinity IAAs.
Figure 2
Figure 2
Relationship between IAA affinity and the age of IAA appearance or HLA phenotype. (A) IAA affinity of the first IAA-positive sample in children who had the HLA DRB1*04/DQB1*0302 haplotype (HLA DR4) compared with those who did not have this haplotype (non–HLA DR4). (B) IAA affinity of the first IAA-positive sample in BABYDIAB children who developed IAAs at age 9 months or 2 years or at 5 years or older.
Figure 3
Figure 3
Relationship between IAA affinity, multiple autoantibodies, and diabetes. (A) IAA affinity (l/mol) in the first IAA-positive sample from 56 children in the BABYDIAB study, in 16 IAA-positive relatives from the Munich family study, and in 11 insulin-treated patients with T1DM. Subjects in the BABYDIAB and Munich family studies are classified as having developed GAD antibodies, IA-2 antibodies, or cytoplasmic islet cell autoantibodies (multiple Ab’s) or not having developed these antibodies (IAAs only). (B) Relationship between IAA affinity (ordinate scale) and IAA titer (abscissa) for the 72 BABYDIAB and Munich family study sera. In A and B, subjects are identified as having developed multiple islet autoantibodies (circles), not having developed multiple islet autoantibodies (crosses), or having transient IAAs (triangles), and as having developed diabetes (filled symbols) or not (open symbols).
Figure 4
Figure 4
Progression to multiple autoantibodies (A) and diabetes (B) with respect to IAA affinity. Life table analysis of the development of multiple islet autoantibodies was done in 33 BABYDIAB children who were IAA positive without other autoantibodies in their first positive sample. Life table analysis of the development of diabetes was performed for all 56 BABYDIAB children included in the study. Children are categorized as having IAA affinity greater than 109 l/mol (solid line) or less than 109 l/mol (dotted line). Multiple antibodies and diabetes developed more frequently in children with IAA affinity greater than 109 l/mol (P = 0.0004 and P = 0.02, respectively).
Figure 5
Figure 5
IAA affinity during follow-up. (A) IAA affinity over time (age) for 92 follow-up samples from 31 subjects. Samples are identified as multiple islet autoantibody positive (circles) or IAA positive only (crosses). Samples from individual subjects are connected by lines. IAA affinity increased by more than 1 log in only 2 subjects (thick broken line) and decreased by more than 1 log in 2 subjects (dotted lines). (B) IAA competitive binding curves for consecutive samples from birth in an IAA-positive BABYDIAB child whose sample at age 9 months had binding characteristics consistent with a 2-site binding model. Binding on the ordinate scale is shown as binding (B) relative to maximal binding in the absence of cold insulin (B0). The inset documents IAA titer and affinity at each follow-up visit.
Figure 6
Figure 6
Relationship between IAA affinity and relative binding to Tyr19A [125I] insulin. Percent binding to Tyr19A [125I] insulin relative to binding to Tyr14A [125I] insulin (abscissa) is shown in relation to IAA affinities (ordinate axis) for individual sera. Children who had or developed multiple islet autoantibodies are indicated by circles and those who did not develop multiple islet antibodies by crosses. Filled symbols represent children who developed diabetes.
Figure 7
Figure 7
Epitope analysis of IAA. (A) Differences in amino acid sequences in the A and B chains of the insulin molecules used for competition studies of IAA binding. (B) Competitive inhibition of IAA binding to Tyr14A [125I] human insulin using human insulin (open circles), human B28lysB29pro insulin (open triangles), human A13trpB28lysB29pro insulin (shaded squares), porcine insulin (shaded circles), sheep A8his insulin (filled diamonds), and fish insulin (crosses). Five patterns were discernible and are shown by representative sera. Forty-six subjects had IAAs with the A8–10/13–dependent binding pattern represented in the top left panel. Six subjects had IAAs with the A8–10/13/B28–30–independent binding pattern represented in the middle left panel. Three subjects had IAA with the B30-dependent binding pattern represented in the top right panel. Three subjects had the B28/29–dependent binding pattern represented in the middle right panel. Seven subjects had the B28–30–dependent binding pattern represented in the bottom panel. (C) Competitive inhibition of IAA binding to Tyr14A [125I] human insulin using human proinsulin (filled circles) for each of the sera shown in B. The dotted line represents competition with human insulin.

References

    1. Atkinson MA, Eisenbarth GS. Type 1 diabetes: new perspectives on disease pathogenesis and treatment. Lancet. 2001;358:221–229. - PubMed
    1. Ziegler AG, Hummel M, Schenker M, Bonifacio E. Autoantibody appearance and risk for development of childhood diabetes in offspring of parents with type 1 diabetes: the 2-year analysis of the German BABYDIAB Study. Diabetes. 1999;48:460–468. - PubMed
    1. Kimpimaki T, et al. Natural history of beta-cell autoimmunity in young children with increased genetic susceptibility to type 1 diabetes recruited from the general population. J. Clin. Endocrinol. Metab. 2002;87:4572–4579. - PubMed
    1. Colman PG, et al. Islet autoimmunity in infants with a Type I diabetic relative is common but is frequently restricted to one autoantibody. Diabetologia. 2000;43:203–209. - PubMed
    1. Yu L, et al. Early expression of antiinsulin autoantibodies of humans and the NOD mouse: evidence for early determination of subsequent diabetes. Proc. Natl. Acad. Sci. U. S. A. 2000;97:1701–1706. - PMC - PubMed

Publication types

MeSH terms