Comparative Study
. 2004 Nov;87(5):2919-30.
doi: 10.1529/biophysj.104.039693. Epub 2004 Aug 17.

A semianalytic model of leukocyte rolling

Affiliations
Comparative Study

A semianalytic model of leukocyte rolling

Ellen F Krasik et al. Biophys J. 2004 Nov.

Abstract

Rolling allows leukocytes to maintain adhesion to vascular endothelium and to molecularly coated surfaces in flow chambers. Using insights from adhesive dynamics, a computational method for simulating leukocyte rolling and firm adhesion, we have developed a semianalytic model for the steady-state rolling of a leukocyte. After formation in a force-free region of the contact zone, receptor-ligand bonds are transported into the trailing edge of the contact zone. Rolling velocity results from a balance of the convective flux of bonds and the rate of dissociation at the back edge of the contact zone. We compare the model's results to that of adhesive dynamics and to experimental data on the rolling of leukocytes, with good agreement. We calculate the dependence of rolling velocity on shear rate, intrinsic forward and reverse reaction rates, bond stiffness, and reactive compliance, and use the model to calculate a state diagram relating molecular parameters and the dynamic state of adhesion. A dimensionless form of the analytic model permits exploration of the parameters that control rolling. The chemical affinity of a receptor-ligand pair does not uniquely determine rolling velocity. We elucidate a fundamental relationship between off-rate, ligand density, and reactive compliance at the transition between firm and rolling adhesion. The model provides a rapid method for screening system parameters for the potential to mediate rolling.


Figures

FIGURE 1
FIGURE 1
Schematic diagram of the semianalytic model. The contact zone of radius L is at separation distance H0 from the wall. Hmax and Hmin are distances at which the reverse reaction rate, kr, is 100 and 2 times the intrinsic rate, formula image respectively. The contact zone is divided into leading and trailing zones where y = Hmin, or x = −L + δ. The bonds in the trailing zone, simplified as a homogenous population of “average” bonds, exert tension at the midpoint between the x coordinates corresponding to Hmax and Hmin.
FIGURE 2
FIGURE 2
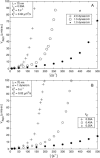
Dimensional results comparable to experimental data of Lawrence and Springer (1991) for neutrophils rolling over P-selectin coated surfaces. Solid markers represent model results with PSGL-1 site density on the neutrophil surface (nRT = 48 #/μm2) taken from Rodgers et al. (2000). Open markers represent experimental data. Parameter values are indicated in legends.
FIGURE 3
FIGURE 3
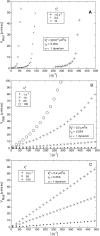
Dimensional rolling velocity as a function of shear rate at several values of σ, the bond spring constant (A) and of rC, the reactive compliance (B). nRT = 48 #/μm2, nLT = 200 #/μm2, ξ = 5 × 10⁻⁴ dyne, and λ = 70 nm.
FIGURE 4
FIGURE 4
Dimensional rolling velocity as a function of shear rate at various formula image for (A) formula image (B) formula image and (C) formula image nLT = 100 #/μm2, ξ = 5 × 10⁻⁴ dyne, and λ = 70 nm.
FIGURE 5
FIGURE 5
Adhesion state diagrams. (A) Semianalytic model dimensional state diagram with formula image intrinsic reverse reaction rate, plotted versus rC, reactive compliance, for bond spring constant, σ, values of 2.5 and 1 dyne/cm. Solid lines enclose rolling state phase space. Open markers correspond to Bell model parameters for various selectins and their ligands, cataloged in Chang et al. (2000). (B) Adhesive dynamics state diagram. The upper and lower boundaries of the transient adhesion state delimit fractional stop times of 0.01 and 0.7, respectively. A mean velocity of 0.5 VH parameterizes the upper boundary of the fast adhesion state, and the dotted and dashed lines correspond to 0.3 VH and 0.1 VH, respectively. Open markers correspond to Bell model parameters for various selectins and their ligands. (Reproduced with permission; Chang et al., 2000).
FIGURE 6
FIGURE 6
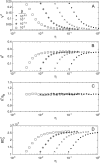
Dimensionless steady-state rolling velocity V* (A), contact angle θ* (B), separation distance scaled by dimensionless equilibrium bond length h*/δB (C), and trailing zone bond density output BD2* (D) as a function of η, ratio of receptor to ligand densities. Upper and lower dashed lines in A indicate 0.5 VH and 0.01 VH, respectively. The curves are parameterized by β, the dimensionless reverse reaction rate, which increases from left to right. The rolling velocity is anti-correlated with BD2*. M0 = 87.6, χ = 0.2, ν = 1.2 × 10⁶, Zbond = 9.38 × 10³, Zgrav = 4.1 × 10⁻⁵, δB = 0.01, and δSS = 0.01.
FIGURE 7
FIGURE 7
State diagram depicting the β-χ boundary between rolling and firm adhesion. (β is the dimensionless reverse reaction rate, and χ is the dimensionless forward reaction rate.) The solid line corresponds to dimensionless parameters in the upper left corner of the figure. Other lines represent boundaries resulting from replacement of an individual parameter with an indicated value. All curves have the same characteristic shape, where β is independent of χ at high χ, but β is proportional to χ at low χ.
FIGURE 8
FIGURE 8
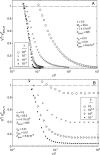
Dependence of rolling velocity on chemical affinity. Rolling velocity, normalized to 50% of the hydrodynamic velocity (V50%H) as a function of χ/β for several values of constant β (A) and constant χ (B). Upper and lower dashed lines indicate 0.01 VH and 0.5 VH, respectively. Chemical affinity does not determine a unique rolling velocity; for one value of χ/β, a range of rolling velocities exists. Conversely, rolling velocity does not require a unique chemical affinity; one value of rolling velocity can be achieved by many χ/β. At high chemical affinity, χ/β, rolling velocity is determined by β.
FIGURE 9
FIGURE 9
State diagram depicting the β-ν/M0 boundary between rolling and firm adhesion. The solid line corresponds to dimensionless parameters in the upper left corner of the figure. Other lines represent boundaries resulting from replacement of an individual parameter with an indicated value. Surprisingly, β is proportional to ν/M0 for all parameter values, leading to a unique scaling for the onset of rolling adhesion.
FIGURE 10
FIGURE 10
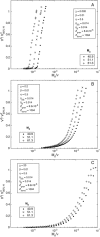
Dimensionless rolling velocity, normalized to 50% VH, as a function of M0/ν, for three values of dimensionless forward rate, χ: (A) 0.002, (B) 0.2, and (C) 20. Results for various values of M0, the ratio of bond-spring energy to thermal energy, appear in each subplot.

Similar articles

Cited by

References

    1. Alon, R., D. A. Hammer, and T. A. Springer. 1995. Lifetime of the P-selectin-carbohydrate bond and its response to tensile force in hydrodynamic flow. Nature. 374:539–542. - PubMed
    1. Alon, R., S. Chen, K. D. Puri, E. B. Finger, and T. A. Springer. 1997. The kinetics of L-selectin tethers and the mechanics of selectin-mediated rolling. J. Cell Biol. 138:1169–1180. - PMC - PubMed
    1. Alon, R., S. Chen, R. Fuhlbrigge, K. D. Puri, and T. A. Springer. 1998. The kinetics and shear threshold of transient and rolling interactions of L-selectin with its ligand on leukocytes. Proc. Natl. Acad. Sci. USA. 95:11631–11636. - PMC - PubMed
    1. Bell, G. I. 1978. Models for the specific adhesion of cells to cells. Science. 200:618–627. - PubMed
    1. Bell, G. I., M. Dembo, and P. Bongrand. 1984. Competition between nonspecific repulsion and specific bonding. Biophys. J. 45:1051–1064. - PMC - PubMed

LinkOut - more resources