Comparative Study
. 2004 Aug 18;24(33):7251-65.
doi: 10.1523/JNEUROSCI.0947-04.2004.

Synaptic transformations underlying highly selective auditory representations of learned birdsong

Affiliations
Comparative Study

Synaptic transformations underlying highly selective auditory representations of learned birdsong

Melissa J Coleman et al. J Neurosci. .

Abstract

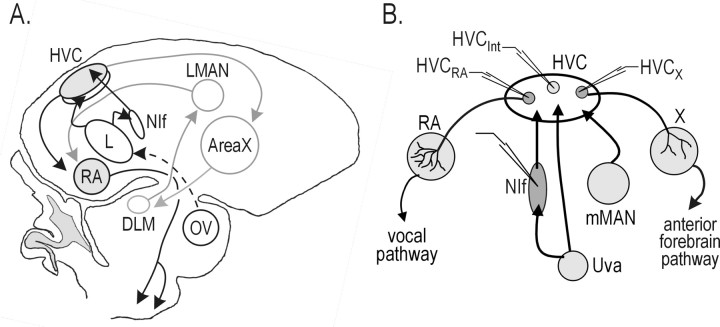
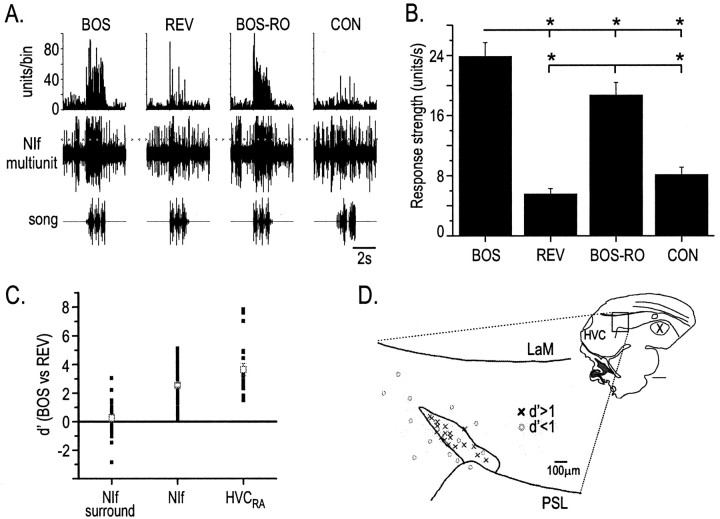
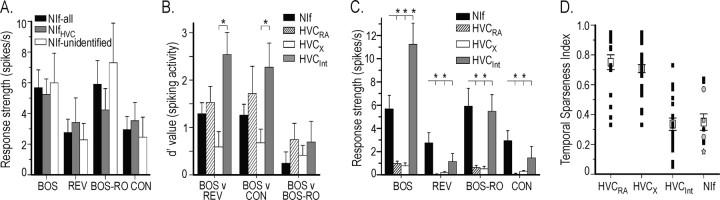
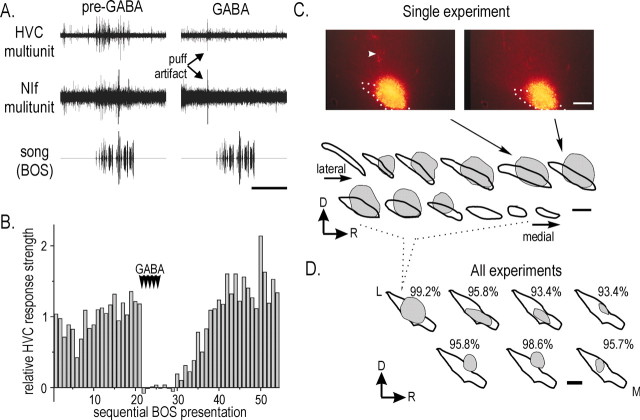
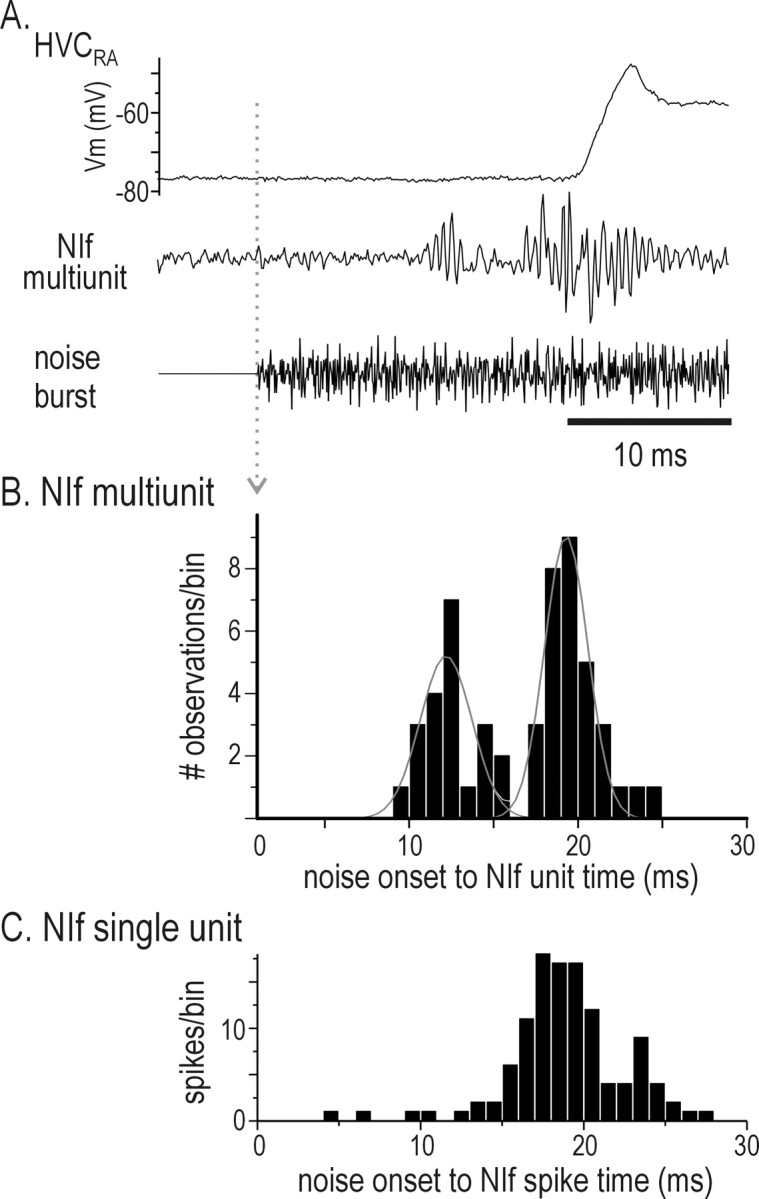
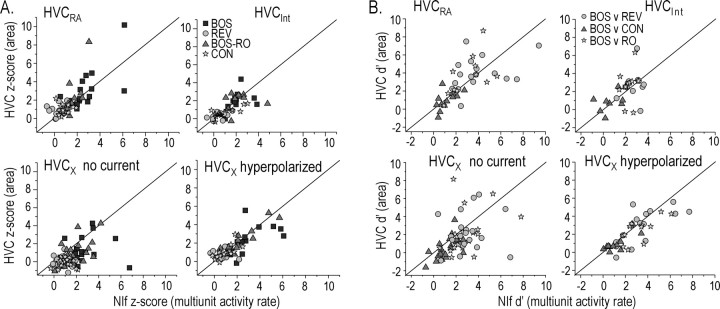
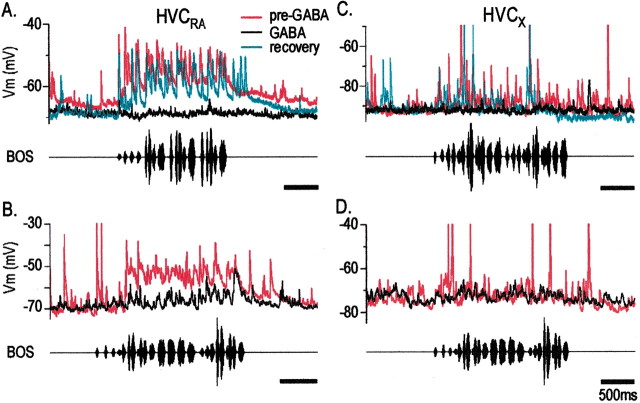
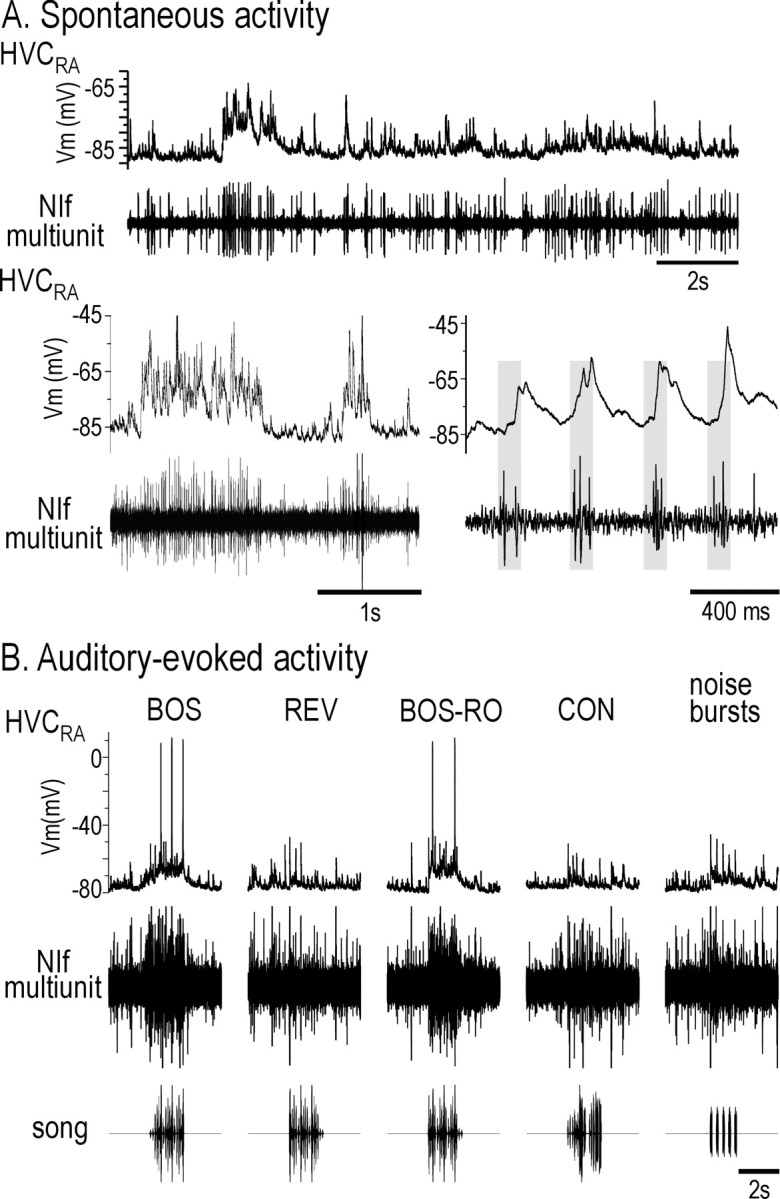
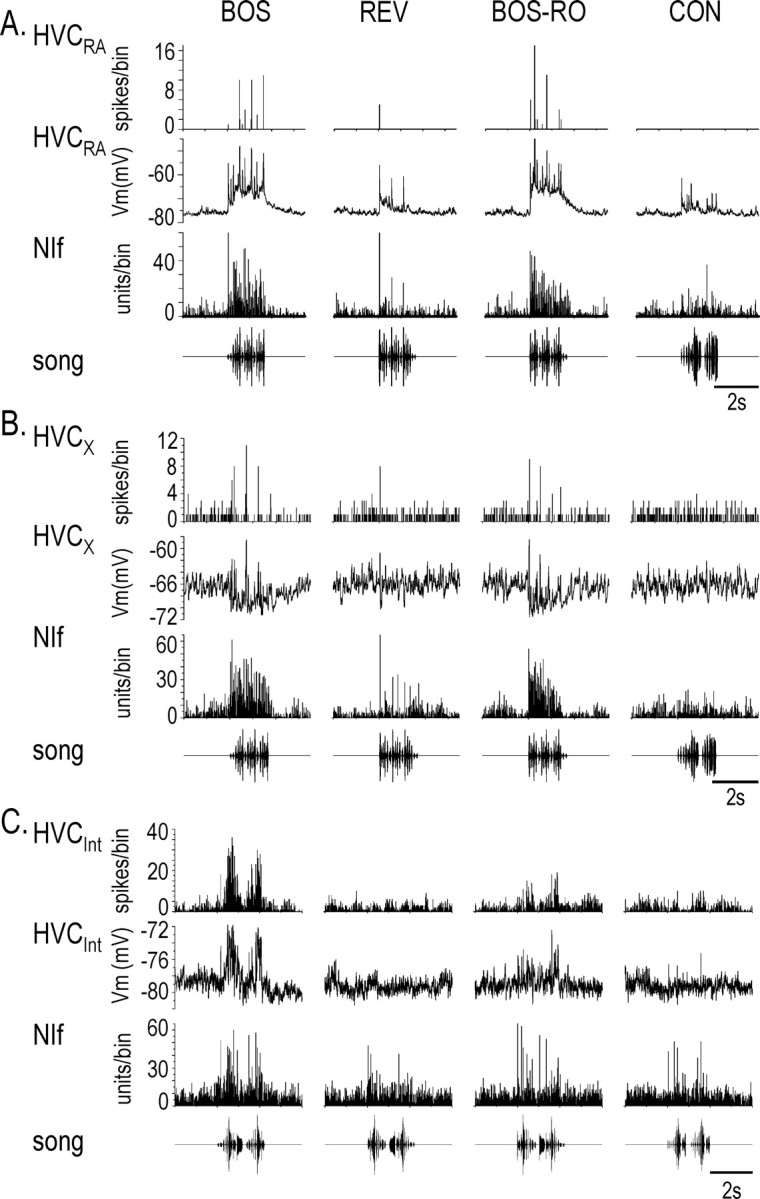
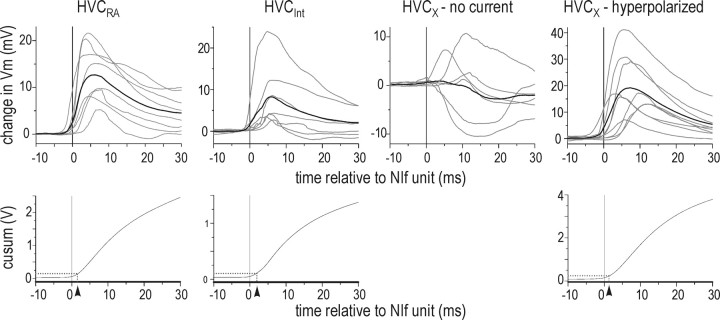
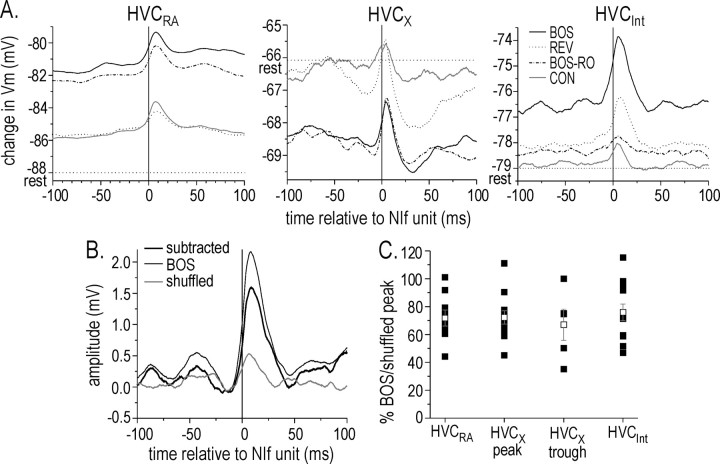
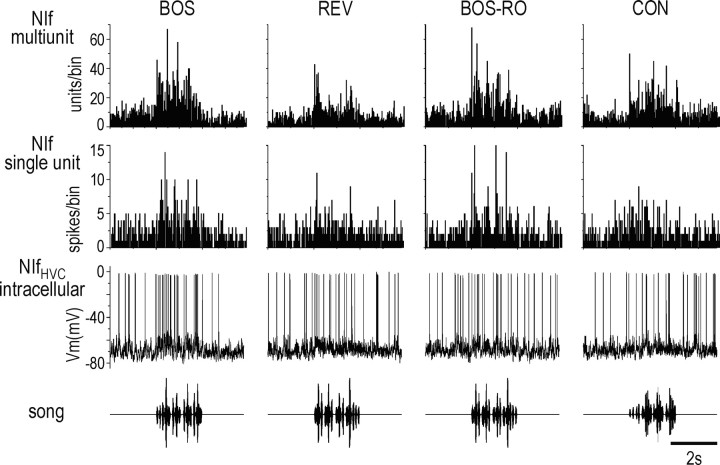
Stimulus-specific neuronal responses are a striking characteristic of several sensory systems, although the synaptic mechanisms underlying their generation are not well understood. The songbird nucleus HVC (used here as a proper name) contains projection neurons (PNs) that fire temporally sparse bursts of action potentials to playback of the bird's own song (BOS) but are essentially silent when presented with other acoustical stimuli. To understand how such remarkable stimulus specificity emerges, it is necessary to compare the auditory-evoked responsiveness of the afferents of HVC with synaptic responses in identified HVC neurons. We found that inactivating the interfacial nucleus of the nidopallium (NIf) could eliminate all auditory-evoked subthreshold activity in both HVC PN types, consistent with NIf serving as the major auditory afferent of HVC. Simultaneous multiunit extracellular recordings in NIf and intracellular recordings in HVC revealed that NIf population activity and HVC subthreshold responses were similar in their selectivity for BOS and that NIf spikes preceded depolarizations in all HVC cell types. These results indicate that information about the BOS as well as other auditory stimuli is transmitted synaptically from NIf to HVC. Unlike HVC PNs, however, HVC-projecting NIf neurons fire throughout playback of BOS as well as non-BOS stimuli. Therefore, temporally sparse BOS-evoked firing and enhanced BOS selectivity, manifested as an absence of suprathreshold responsiveness to non-BOS stimuli, emerge in HVC. The transformation to a sparse auditory representation parallels differences in NIf and HVC activity patterns seen during singing, which may point to a common mechanism for encoding sensory and motor representations of song.


Figures

Figure 1.
Figure 1.
Schematic of the zebra finch song system and anatomic convergence to and divergence from HVC. A, Schematic of the song system. Black lines indicate the vocal motor pathway, and gray lines indicate the anterior forebrain pathway. The area under HVC, known as “HVC shelf,” is the area to which field L projects. B, Schematic of HVC afferents (mMAN, Uva, and NIf) and efferents (RA and area X) and recording paradigm. For the experiments in this paper, multiunit extracellular and intracellular recordings were made from NIf, and intracellular recordings were made from individual HVC neurons, including HVCRA, HVCX, and HVCInt. DLM, Dorsolateral part of the medial thalamus; HVC, nucleus HVC of the nidopallium; HVCInt, HVC interneurons; HVCRA, HVC neurons that project to RA; HVCX, HVC neurons that project to area X; LMAN, lateral magnocellular nucleus of the anterior nidopallium; L, field L; mMAN, medial magnocellular nucleus of the anterior nidopallium; NIf, interfacial nucleus of the nidopallium; OV, ovoidalis; RA, robust nucleus of the arcopallium; Uva, nucleus uvaeformis; X, area X.
Figure 2.
Figure 2.
NIf auditory responses. A, Bottom row, Oscillograms of song stimuli, including BOS, BOS in reverse (REV), BOS in which the syllable order is reversed (BOS-RO), and conspecific song (CON). Middle row, Multiunit extracellular recording from NIf showing responses to a single playback of each auditory stimulus. Dotted line indicates approximate location of threshold set for unit detection. Top row, PSTH of NIf multiunit activity in response to 20 iterations of each auditory stimulus. B, Average response strength (mean ± SEM) of NIf multiunit activity to each auditory stimulus. The response strength to BOS was significantly greater than to all other stimuli presented, and the response strength to BOS-RO was significantly greater than that to REV and CON. *p < 0.05.C, Comparison of the selectivity for BOS over REV of action potential activity in NIf-surround and NIf, and subthreshold activity in HVCRA neurons, using the d′ metric. d′ values for NIf and NIf-surround were calculated from the units per second at each recording site; d′ values for HVCRA were calculated from subthreshold responses. Black filled squares are d′ values from single recording sites in field L and NIf or single HVCRA neurons. Gray open squares are mean values (± SEM) for each group. D, Anatomic localization of a subset of NIf recording sites with their selectivity (d′) for BOS over REV. NIf has been collapsed in the lateral to medial extent. Inset, Outline of a sagittal section of a zebra finch brain to show the location of NIf relative to other structures. Scale bar, 1 mm. LaM, Mesopallial lamina; PSL, pallial-subpallial lamina.
Figure 12.
Figure 12.
Comparison of auditory-evoked action potential activity of single NIf neurons with individual HVC neurons. A, Response strength of action potential activity in individual NIf neurons. All recorded NIf neurons (black bars) were subdivided into two groups: one in which NIfHVC neurons were positively identified anatomically (n = 5; gray bars) and the second in which the NIf neurons were unidentified (n = 7; white bars). For a given stimulus, the response strengths of these three groups were statistically similar (ANOVA). B, Comparison of d′ values for action potential activity in NIf (single unit), HVCRA, HVCX, HVCInt neurons. BOS was compared with REV, CON, and BOS-RO; only HVCInt was significantly different for REV and CON (*p < 0.05). C, Comparison of response strength for action potential activity in NIf and the three HVC neuron types. *p < 0.05. D, Comparison of the relative degree of temporally sparse firing in response to BOS playback in NIf neurons and all three HVC neuron types. HVC PNs (HVCRA and HVCX) have a larger sparseness index (i.e., fire more sparsely) to BOS than do HVCInt or NIf neurons. Black squares indicate temporal sparseness index for individual neurons; open squares indicate mean (±SEM). The temporal sparseness index for NIf neurons was subdivided into those that were either unidentified (black squares) or anatomically identified as NIfHVC neurons (gray circles). Because two of the NIf neurons had the same temporals parseness index (0.15), one is shown as a star behind the circle representing the other.
Figure 3.
Figure 3.
NIf inactivation abolishes BOS-evoked action potential responses in HVC. A, Raw data showing the abolition of BOS-evoked activity in HVC after GABA application to NIf. Bottom trace, Oscillogram of song stimuli. Middle trace, Multiunit extracellular recording of NIf. Top trace, Multiunit extracellular recording of the ipsilateral HVC. Left, Before GABA application, BOS presentation increased activity in both NIf and HVC. Right, GABA application to NIf immediately before BOS stimulation completely abolished the BOS response in HVC (note puff artifact denoting time of GABA application). Calibration: 2 sec. B, Changes in HVC response strength before, during, and after GABA application in NIf for the experiment shown in A. Each bar represents the normalized response strength (units per second) to each sequential BOS stimulation. Normalized responses were calculated as the response strength to each BOS presentation, divided by the average pre-GABA response strength. GABA was applied to NIf after the 21st BOS presentation for five iterations (arrowheads). After GABA application, the HVC response strength to BOS recovered to baseline levels. C, Rhodamine labeling relative to NIf location in serial sagittal sections from the experiment in A and B. Top panel, Photomicrographs of rhodamine localization relative to NIf. The boundary of NIf was determined from dark-field illumination of the same section (data not shown) and is outlined by the white dotted line. Arrowhead in the left image points to the electrode track. Arrows point to the drawing of the outline of NIf and rhodamine labeling that was used to generate the serial sections. Bottom panel, Serial sagittal sections in which NIf is outlined in black, and the location of recovered rhodamine labeling is in gray. Dorsal (D) is up; rostral (R) is right. Scale bar: C, D, 200 μm. D, Summary maps of rhodamine localization relative to NIf for each GABA inactivation experiments. In each case, a standard outline of NIf (as in Fig. 2 D) is used for each experiment, and the location of rhodamine labeling within NIf is illustrated in gray. The top left example is the same example illustrated in C. Percentages refer to the reduction in HVC BOS-evoked response strength during GABA application.
Figure 9.
Figure 9.
Timing of NIf multiunit and single-unit activity and subthreshold response in an HVCRA neuron to a white noise burst. A, Response of NIf (middle trace) and HVCRA (top trace) to a single presentation of a white noise burst (bottom trace). Note the two different bursts of action potential activity generated in NIf. B, Timing of NIf activity relative to the onset of the white noise burst. The frequency histogram shows the onset times for all NIf units that we recorded (see Materials and Methods for determination of onset times). The binned onset times for all NIf recordings were fit with two Gaussians (gray lines). Bin size = 1 msec. The histogram in B has the same time scale and is aligned with the noise burst onset in A (gray dotted line with arrow). C, Histogram of action potential activity from an intracellularly recorded NIf neuron that projects to HVC (NIfHVC), relative to noise burst onset (time 0). The response is the result of 100 noise burst presentations. This neuron did not have any current injected through the recording electrode. Bin size = 1 msec. The histogram is aligned with the noise burst onset in A and B.
Figure 7.
Figure 7.
NIf multiunit activity and HVC subthreshold activity are comparable in both their response to auditory stimuli and their selectivity for BOS versus non-BOS stimuli. A, Comparison of auditory-evoked z-score values in simultaneously recorded NIf and HVC neurons. z-score values were calculated for four different auditory stimulations: BOS (dark gray squares), REV (light gray circles), BOS-RO (gray triangles), and CON (stars). Top row, z-score values for NIf activity and subthreshold responses in HVCRA and HVCInt were distributed evenly about the unity line for all auditory stimuli presented. Bottom row, z-score comparisons were made for HVCX neurons when HVCX neurons were either near resting membrane potential (no current; left) or when HCVX neurons were hyperpolarized (right). The z-score values for HVCX neurons near resting membrane potential are calculated using the negative area response to auditory presentation, whereas the z-score values for HVCX neurons that were hyperpolarized were calculated using the positive area response to auditory presentations. z-score values for NIf activity and subthreshold activity in HVCX neurons that were hyperpolarized were distributed evenly about the unity line, whereas z-score values calculated with no current were smaller, on average, than NIf multiunit activity z-scores. Significance levels are shown in Table 1. B, NIf activity and HVC subthreshold responses have a similar selectivity for BOS over non-BOS stimuli. The d′ values (BOS vs REV, BOS vs CON, BOS vs BOS-RO) for NIf firing rate are plotted against the d′ values for the subthreshold activity in simultaneously recorded HVC neurons. The d′ values for HVCX neurons are plotted for HVCX neurons close to their resting membrane potential and for HVCX neurons that were hyperpolarized. Black diagonal line is the unity line.
Figure 4.
Figure 4.
NIf inactivation abolishes or reduces auditory-evoked subthreshold activity in both HVC projection neurons subtypes, HVCRA and HVCX. A, Before GABA application to NIf (red trace), BOS presentation elicited a depolarizing response in an HVCRA neuron. After GABA application to NIf, there was an almost total absence of the BOS-evoked subthreshold response (black trace). The BOS-evoked subthreshold response in HVCRA recovered to near pre-GABA controls after GABA application ceased (cyan trace). B, In another bird, the application of GABA to NIf resulted in a reduction (black trace) of the BOS-evoked response an HVCRA neuron, as compared with pre-GABA response (red trace). The recording was lost immediately after GABA application, so recovery was not observed. C, GABA application to NIf resulted in the near abolition of BOS-evoked activity in an HVCX neuron, which recovered after GABA application ceased. Color conventions are as in A and B. D, In another bird, GABA inactivation of NIf resulted in a reduction in the BOS-evoked synaptic response in an HVCX neuron. The recording was lost immediately after GABA application, so recovery was not observed. B, D, Recordings from opposite hemispheres of the same bird. Calibration for all traces: 500 msec.
Figure 5.
Figure 5.
Spontaneous and auditory-evoked action-potential activity in NIf is similar to subthreshold activity in HVCRA neurons. A, Spontaneous activity in NIf and HVCRA. The top trace and two bottom traces are recordings from two different NIf-HVCRA pairs. The bottom right trace shows that NIf multiunit activity precedes depolarizing PSPs in the HVCRA neuron. B, Raw data showing the response of simultaneously recorded NIf and HVCRA to auditory stimuli. The bottom row shows the stimuli presented, and the middle and top rows show the multiunit response of NIf and intracellularly recorded response in HVCRA, respectively, to a single presentation of each of the auditory stimuli. The noise burst stimulus is five sequential presentations of short duration (50 msec) white noise bursts. Both NIf and the HVCRA neuron respond best to BOS and BOS-RO and less so to the other auditory stimuli. Although NIf fires to all stimuli presented, HVCRA fires only to BOS and BOS-RO. Note the onset response in NIf and the HVCRA neuron to white noise bursts. No current was being injected into the HVCRA neuron during this recording.
Figure 6.
Figure 6.
Cumulative action potential responses in NIf and the three HVC neuron cell types and average subthreshold responses in HVC neurons to auditory stimulation. A-C, Bottom row, song presentation; third row, PSTH for NIf units; second row, median-filtered, average membrane potential for each HVC neuron; top row, PSTH for spikes generated in the HVC neuron. Bin size = 25 msec. A and B are recordings from the same hemisphere of the same bird. A, Auditory-evoked response in NIf and HVCRA. Each stimulus elicited increased multiunit activity in NIf and a net depolarization in the HVCRA neuron. BOS and BOS-RO elicited the largest excitation of NIf and HVCRA. This is the same simultaneously recorded NIf and HVCRA pair shown in Figure 5B, in response to 10 iterations of each auditory stimulus. B, Auditory-evoked responses in NIf and HVCX. Presentation of BOS and BOS-RO resulted in increased firing in NIf and a net hyperpolarization of the HVCX membrane potential (10 iterations of each auditory stimulus were presented). There was little change in the HVCX membrane potential during playback of REV and CON. No current was being injected into the HVCX neuron during this recording. C, Auditory-evoked responses in NIf and HVCInt. Auditory presentation elicited a concomitant excitation in NIf and HVCInt neurons during playback of BOS and BOS-RO. There was little excitation in NIf and HVCInt during playback of REV and CON (10 iterations of each auditory stimulus). Tonic hyperpolarizing current (-0.47 nA) was injected into HVCInt during the recording.
Figure 10
Figure 10
Spike-triggered averages of each HVC neuron cell type membrane potential, calculated from NIf multiunit activity elicited by the onset of noise bursts. Top row, NIf STA peaks in HVCRA and HVCInt were depolarizing. STA peaks in HVCX were biphasic, with an initial depolarizing peak and later hyperpolarizing peak, when the HVCX neurons were near resting membrane potential (no current); STA peaks were monophasic and depolarizing when HVCX neurons were tonically hyperpolarized. Gray lines indicate individual STAs; black line indicates average STA. Black vertical line at 0 msec indicates time of NIf trigger event. Bottom row, Estimation of the peak onset time with the cusum of the average STA for each HVC neuron. The peak onset time was set to 5% of the cusum maximum (dotted line), set at 30 msec after the unit time. The peak onset time is illustrated by the arrowheads.
Figure 8.
Figure 8.
Auditory stimulation resulted in a net shift in membrane potential in HVC neurons and peaks in the membrane potential that were correlated with NIf multiunit activity. A, STAs of membrane potential changes in each HVC cell type calculated relative to NIf trigger events revealed a net depolarization in HVCRA to BOS and BOS-RO and in HVCInt neurons to BOS. STAs calculated during BOS and BOS-RO resulted in a net hyperpolarization in HVCX neurons when these cells were left near their resting membrane potential. In addition, these STAs contained a peak after the NIf trigger event time (black line at 0 msec). The horizontal dotted line in each graph denotes the membrane potential of the neuron before auditory presentation. B, Example of the STA that remained (subtracted, thick black line) after the STA from a shuffled NIf and HVCRA neuron response to BOS (gray line) was subtracted from the raw STA response (thin black line). The subtracted STA accounts for ∼70% of the raw STA. C, Percentage of the BOS response relative to the shuffled response for each HVC cell type. Black filled squares indicate individual responses; open squares indicate mean response (±SEM). The responses for the HVCX peak and trough are given as different values.
Figure 11.
Figure 11.
Comparison of song-evoked multiunit NIf activity with single-unit NIfHVC activity. Bottom panel, Oscillogram of song stimuli; third panel, response of a NIfHVC neuron to a single playback of each song stimulus. In this recording, no current was being injected through the recording electrode. Second panel, PTSH of the action potential response of this neuron to 20 iterations of each song presentation. Top panel, PSTH of the multiunit activity of the same NIf to 20 iterations of each song presentation.

Similar articles

Cited by

References

    1. Boco T, Margoliash D (2001) NIf is a major source of auditory and spontaneous drive to HVc. Soc Neurosci Abstr 27: 318.2.
    1. Bottjer SW, Halsema KA, Brown SA, Miesner EA (1989) Axonal connections of a forebrain nucleus involved with vocal learning in zebra finches. J Comp Neurol 279: 312-326. - PubMed
    1. Brecht M, Sakmann B (2002) Dynamic representation of whisker deflection by synaptic potentials in spiny stellate and pyramidal cells in the barrels and septa of layer 4 rat somatosensory cortex. J Physiol (Lond) 543: 49-70. - PMC - PubMed
    1. Bringuier V, Chavane F, Glaeser L, Fregnac Y (1999) Horizontal propagation of visual activity in the synaptic integration field of area 17 neurons. Science 283: 695-699. - PubMed
    1. Carandini M, Ferster D (2000) Membrane potential and firing rate in cat primary visual cortex. J Neurosci 20: 470-484. - PMC - PubMed

Publication types

LinkOut - more resources